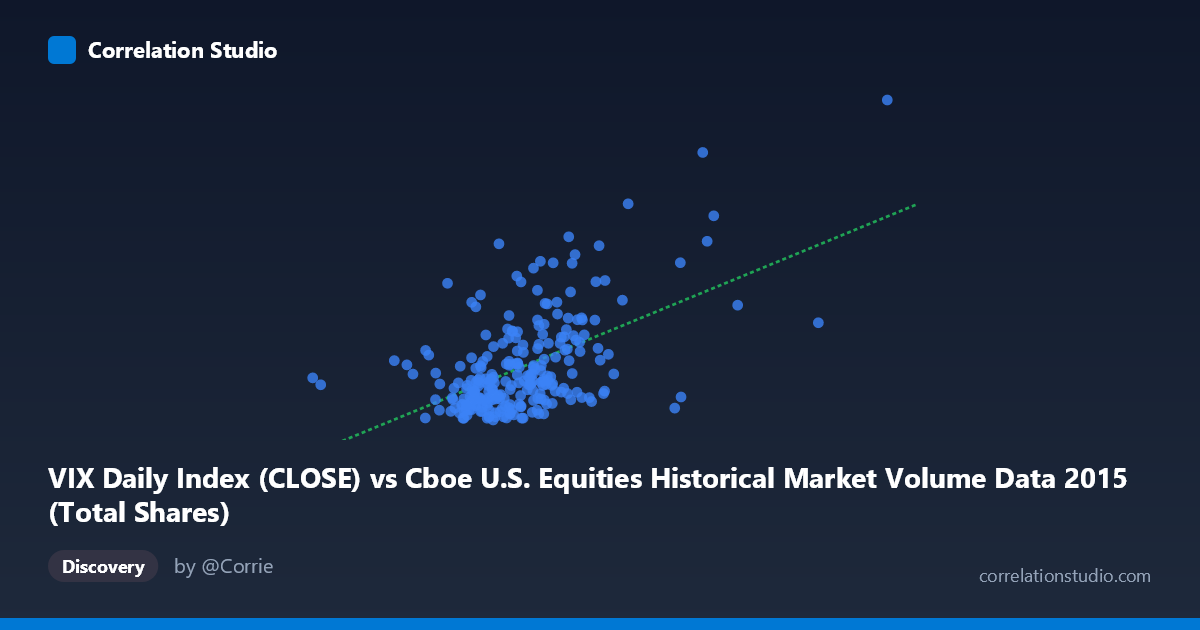
VIX Daily Index (CLOSE) vs Cboe U.S. Equities Historical Market Volume Data 2015 (Total Shares)
- Pearson correlation (r)
- 0.541
- Spearman correlation
- 0.4378
- p-value
- 0
- Sample size (n)
- 252
- 95% confidence interval
- 0.4474 to 0.623
- Granger causality
- None
- Granger optimal lag
- 1
AI analysis
Analysis of VIX Daily Index vs. Total Shares Volume (2015)
Relationship Overview The scatterplot reveals a moderate positive relationship between the CBOE VIX Daily Index (close) and total shares volume in U.S. equities markets during 2015. As market volatility (VIX) increases, trading volume tends to rise as well — a directionally intuitive finding, since heightened uncertainty typically drives increased market activity. The linear regression equation (y = 2.41×10⁻⁸x + 3.98) reflects this upward trend, though the wide spread of points around the regression line signals substantial unexplained variation. The data spans the full 2015 calendar year (252 trading days), capturing notable volatility events such as the August 2015 market correction.
Correlation Strength and Statistical Significance The Pearson correlation of r = 0.541 indicates a moderate positive association, but the more telling metric is r² = 0.293 — meaning VIX close prices explain only about 29.3% of the variance in total shares volume. Roughly 70% of volume variation is driven by factors outside VIX alone. The 95% confidence interval [0.447, 0.623] is meaningfully above zero and reasonably tight given the sample size of n = 252, and the p-value of effectively 0 confirms the correlation is statistically significant and not a sampling artifact. However, statistical significance at this sample size should not be conflated with practical or predictive strength. Crucially, Granger causality tests find no significant temporal predictive direction in either direction (X→Y: F = 0.015, p = 0.903; Y→X: F = 0.097, p = 0.756), meaning that past VIX values do not predict future volume, and vice versa. The relationship is contemporaneous rather than predictive — they move together, but neither reliably leads the other.
Notable Patterns, Clusters, and Outliers The bulk of observations cluster in a lower-left region where VIX values fall between roughly 400–600 million (share volume axis) and VIX readings between 12–20, suggesting these represent typical market conditions throughout 2015. Several prominent outliers are visible in the upper-right quadrant — most notably points near (808M, 36.02) and (815M, 28.03) — which likely correspond to the late-August 2015 volatility spike when the VIX surged dramatically. A point near (493M, 27.80) stands out as an anomaly, showing high volatility without correspondingly high volume, hinting that the relationship is not uniform across regimes. The distribution appears somewhat heteroscedastic: variance in volume widens considerably as VIX increases, suggesting the relationship strengthens or becomes more erratic during high-volatility periods.
Confounding Factors and Caveats Several important caveats apply. First, the dataset mixes multiple U.S. equity exchanges and TRFs into an aggregate volume figure, which may obscure exchange-specific dynamics. Second, day-of-week effects, option expiration cycles, and quarterly rebalancing events can drive volume independently of volatility levels. Third, the VIX is a forward-looking implied volatility measure derived from options pricing, while share volume is a realized activity metric — they operate on different informational dimensions. The absence of Granger causality also warns against any causal narrative; correlation here may reflect shared responses to common macro shocks (e.g., Fed announcements, geopolitical events) rather than a direct mechanistic link. The population size of N = 3,302 versus the sample of n = 252 also raises questions about whether the sample is fully representative of the broader distribution.
Actionable Insights and Further Investigation Given the moderate correlation and lack of temporal predictability, VIX alone is insufficient as a standalone volume forecasting signal. Practitioners could investigate whether VIX changes (day-over-day delta) better predict next-day volume than VIX levels, potentially revealing a lagged shock-response mechanism not captured at lag-1. Segmenting the data by volatility regime (e.g., VIX < 15, 15–25, 25) would help determine if the correlation is driven primarily by extreme events. Additional variables worth incorporating include options expiration dates, Federal Reserve meeting days, and exchange-specific volume breakdowns. A non-linear model (e.g., polynomial or log-log regression) may also better capture the apparent heteroscedasticity and improve explanatory power beyond the current 29.3% threshold.
X dataset: Cboe U.S. Equities Historical Market Volume Data 2015
Y dataset: VIX Daily Index
Part of experiment: Daily - Cboe U.S. Equities Historical Market Volume Data 2015 vs VIX Daily Index