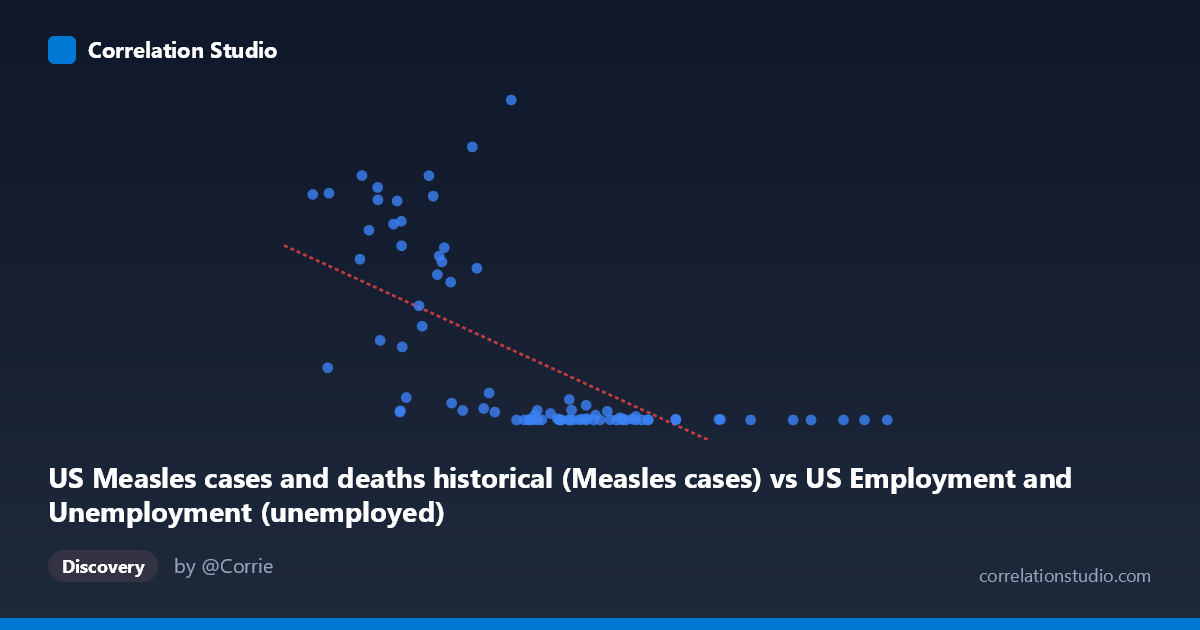
US Measles cases and deaths historical (Measles cases) vs US Employment and Unemployment (unemployed)
- Pearson correlation (r)
- -0.6476
- Spearman correlation
- -0.76
- p-value
- 0
- Sample size (n)
- 85
- 95% confidence interval
- -0.7564 to -0.5041
- Granger causality
- None
- Granger optimal lag
- 10
- Time coverage
- 1941-01-01 to 2025-01-01
- Recomputed on refreshed data
- 2026-10-17 (r was -0.6476)
AI analysis
Scatterplot Analysis: US Measles Cases vs. Unemployment
1. Overall Relationship Pattern
The scatterplot reveals a striking negative relationship between US measles cases (X-axis) and unemployment numbers (Y-axis), spanning data from 1941 to 2025. The pattern shows that when measles cases were historically high, unemployment figures were relatively lower, and as measles cases declined dramatically over the decades (particularly following vaccine introduction in 1963), unemployment numbers occupy a wide range of values. Visually, the data points cluster heavily toward the lower end of the X-axis (low measles cases, post-vaccination era) with substantial vertical spread, while the upper-left quadrant contains the high-measles, high-unemployment historical observations. The overall shape suggests the relationship is far from linear — the data exhibits a pronounced curve or hyperbolic pattern, with a long tail of high-Y values at low X values.
2. Correlation Strength, Direction, and Causality
The Pearson r of -0.6476 indicates a moderate-to-strong negative correlation, but the explanatory power is more modest: R² = 0.4194, meaning only about 42% of the variance in unemployment is statistically explained by measles cases. Approximately 58% of the variance in unemployment is attributable to other factors entirely unrelated to this model. The 95% confidence interval of [-0.7564, -0.5041] is reasonably tight and entirely negative, confirming the direction is reliable, and the p-value of 2.10 × 10⁻¹¹ makes this statistically significant well beyond conventional thresholds — so the correlation itself is not a chance finding. However, the Granger causality analysis returns no significant predictive direction in either direction (X→Y: F = 0.9559, p = 0.4915; Y→X: F = 1.0130, p = 0.4449), which is a crucial qualifier: neither variable temporally predicts the other. This means the correlation, however statistically robust, carries no mechanistic or predictive causal weight between the two series.
3. Notable Patterns, Clusters, and Outliers
Several structural features stand out. There is a dense cluster of low-measles/low-to-moderate unemployment points in the lower-left region of the plot, representing post-1963 vaccination-era years where measles cases collapsed to near zero. Contrasting this are scattered high-Y observations — particularly points like (5560, 894134), (2055, 530118), (2852, 555156), (1883, 683077), and (4602, 763094) — which represent high unemployment periods (likely the Great Depression era, World War II labor transitions, or early postwar adjustments). The point (5560, 894134) is a notable outlier with the highest unemployment value in the dataset. The Spearman ρ exceeding Pearson r is an important diagnostic flag, explicitly confirming that a non-linear model (logarithmic or polynomial) would better characterize this relationship than the fitted linear regression y = -52.02x + 485,961.
4. Confounding Factors and Critical Caveats
This correlation is a textbook example of spurious correlation driven by shared temporal trends. Both measles cases and unemployment have undergone massive secular changes over the 1941–2025 period for completely independent reasons: measles cases declined due to the 1963 vaccine introduction and subsequent immunization programs, while unemployment fluctuated in response to economic cycles, recessions, policy changes, labor force growth, and demographic shifts. The common thread is simply time — both variables changed dramatically over eight decades, creating a mathematical correlation with no plausible biological or economic mechanism connecting them. Additionally, the dataset mismatch noted in the axis labels (measles data in the employment dataset field and vice versa) warrants verification for data integrity. The wide standard deviations (Y stdev: 248,232 vs. mean: 161,068) indicate extreme dispersion, and any linear regression applied to this data should be interpreted with great caution.
5. Actionable Insights and Further Investigation
Given the absence of Granger causality and the near-certainty of spurious correlation, no policy or public health action should be inferred from this relationship. However, this dataset pair offers several productive analytical directions: (1) Apply time-detrending or first-differencing to both series to remove the dominant secular trend and test whether any residual correlation persists; (2) Fit a logarithmic or power-law regression as suggested by the Spearman/Pearson divergence, which may better characterize the distributional shape; (3) Investigate whether the high-unemployment, moderate-measles cluster (points like 2,333–2,975 X range) represents a specific historical period (e.g., late 1940s–early 1950s) warranting era-specific analysis; (4) Use this as a pedagogical case study in distinguishing statistical significance from practical or causal significance — the p-value is overwhelming, yet the relationship is almost certainly meaningless mechanistically, illustrating why Granger causality and domain knowledge must accompany correlation analysis.
X dataset: US Employment and Unemployment
Y dataset: US Measles cases and deaths historical
Part of experiment: Yearly - US Employment and Unemployment vs US Measles cases and deaths historical