NASDAQ Composite Index Daily (FRED) (NASDAQCOM) vs Cboe U.S. Equities Historical Market Volume Data 2009 (Tape A Shares)
- Pearson correlation (r)
- -0.4889
- Spearman correlation
- -0.4866
- p-value
- 0
- Sample size (n)
- 252
- 95% confidence interval
- -0.5776 to -0.3888
- Granger causality
- None
- Granger optimal lag
- 10
AI analysis
Analysis: NASDAQ Composite Index vs. Cboe U.S. Equities Market Volume (2009)
Relationship Overview
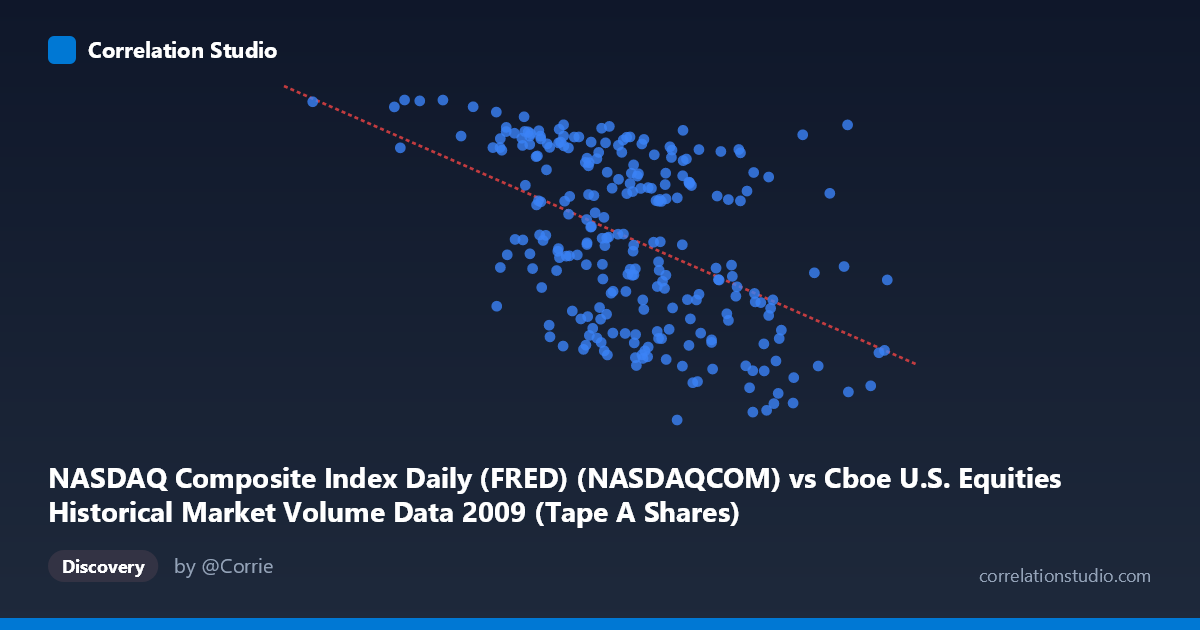
The scatterplot reveals a negative relationship between daily NASDAQ Composite Index values (X-axis) and Cboe U.S. Equities Tape A share volume (Y-axis) across 252 trading days in 2009. The linear regression equation (y = -1.35×10⁻⁶x + 2,438.2) confirms that as the NASDAQ index rose throughout 2009's recovery from the financial crisis, Tape A share volume tended to decline. This pattern is economically intuitive: the early part of 2009 featured extreme market stress, panic selling, and historically elevated trading volumes, while the subsequent equity rally was accompanied by more normalized, lower-volume conditions — a classic "climbing the wall of worry" dynamic where rising prices coincide with declining participation intensity.
Correlation Strength and Statistical Significance
The correlation of r = -0.489 represents a moderate negative association, but the more practically meaningful statistic is r² = 0.239, indicating that NASDAQ index levels explain only about 23.9% of the variance in Tape A share volume. This leaves over three-quarters of volume variability unexplained by index level alone. The 95% confidence interval of [-0.578, -0.389] is meaningfully negative throughout and does not cross zero, providing strong directional confidence. The p-value of 2.22×10⁻¹⁶ confirms the relationship is highly statistically significant, effectively ruling out chance given n = 252 observations. However, the Granger causality analysis tells an important cautionary tale: neither direction (X→Y nor Y→X) achieves significance at the 0.05 threshold (F = 1.79, p = 0.065 and F = 1.12, p = 0.345, respectively at optimal lag 10). This means that while the two series are correlated contemporaneously, neither reliably predicts the other's future values — the relationship is associative rather than temporally directional, limiting its use for forecasting or causal inference.
Notable Patterns, Clusters, and Outliers
Several structural features stand out in the data. There is a visible cluster of high-volume, lower-index observations concentrated in the left portion of the chart (NASDAQ roughly 105M–300M range, Tape A shares above ~2,000), consistent with early 2009's crisis-era trading environment. Conversely, the right side of the chart (higher NASDAQ values, 550M–704M) shows predominantly lower Tape A volume, though with notable scatter and some high-volume exceptions — for instance, the point near (662,852,097; 2,211.69) represents an unusually high-volume day despite an elevated index level, suggesting event-driven or structural anomalies. The outlier at approximately (105,713,300; 2,285.69) anchors the extreme low-index, high-volume region. The spread of residuals widens in the mid-range of X values, suggesting mild heteroscedasticity — the relationship is less predictable at intermediate index levels than at the extremes.
Confounding Factors and Caveats
Several important confounders complicate this interpretation. Temporal autocorrelation is a primary concern: both the NASDAQ index and trading volume are time series with strong serial dependence, meaning that observations are not truly independent — a core assumption of standard correlation analysis. The 2009 period is also a structurally unusual regime: it spans the tail of the 2008-2009 financial crisis through a dramatic recovery rally, meaning the negative correlation may largely reflect a one-time regime shift rather than a persistent structural relationship. Algorithmic and high-frequency trading dynamics, which were accelerating in 2009, could independently drive volume patterns unrelated to index level. Additionally, the dataset covers only Tape A shares (NYSE-listed securities reported to Cboe), while the NASDAQ Composite reflects NASDAQ-listed stocks — there is an inherent cross-venue mismatch between X and Y that introduces measurement noise into the correlation.
Actionable Insights and Further Investigation
Given these findings, several investigative directions are warranted. First, decomposing the time series into trend and volatility components (e.g., using VIX as a covariate) would help determine whether the negative correlation persists after controlling for the crisis-to-recovery regime shift. Second, analysts should examine whether the relationship holds across multiple calendar years — if the negative correlation is unique to 2009's unusual market structure, it would not be reliable for strategy development. Third, despite the Granger causality null result at lag 10, testing shorter lags (1–5 days) for intraday or next-day volume prediction could reveal fleeting predictive windows, particularly around index threshold levels. Finally, replacing Tape A volume with total consolidated market volume or a volatility-adjusted volume metric (such as volume/VIX) would better isolate the structural component of the relationship and reduce the cross-venue mismatch that currently limits interpretive confidence.
X dataset: Cboe U.S. Equities Historical Market Volume Data 2009
Y dataset: NASDAQ Composite Index Daily (FRED)
Part of experiment: Daily - Cboe U.S. Equities Historical Market Volume Data 2009 vs NASDAQ Composite Index Daily (FRED)