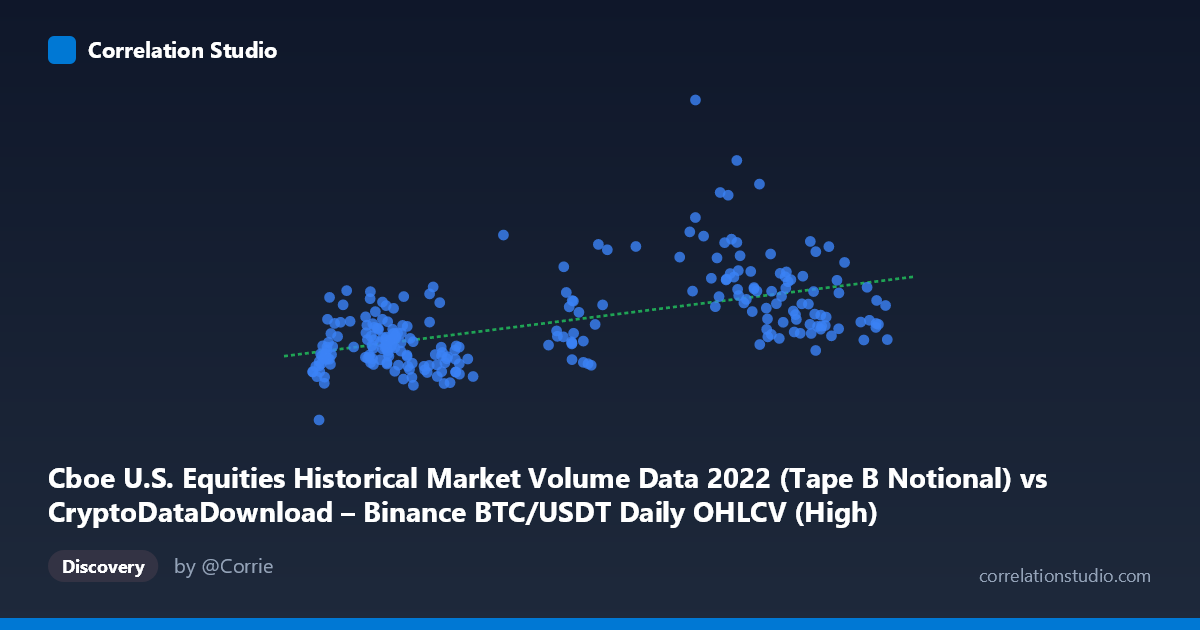
Cboe U.S. Equities Historical Market Volume Data 2022 (Tape B Notional) vs CryptoDataDownload – Binance BTC/USDT Daily OHLCV (High)
- Pearson correlation (r)
- 0.5591
- Spearman correlation
- 0.5408
- p-value
- 0
- Sample size (n)
- 251
- 95% confidence interval
- 0.4676 to 0.6387
- Granger causality
- None
- Granger optimal lag
- 10
AI analysis
Analysis: Cboe Equities Volume vs. Binance BTC/USDT Price
1. What the Visualization Reveals
The scatterplot displays a moderate positive relationship between U.S. equities market volume (notional value, mislabeled as X-axis but representing Cboe Tape B volume) and BTC/USDT daily high prices in 2022. As equity market volume increases, Bitcoin's daily high tends to increase as well, though the relationship shows considerable scatter rather than a tight linear band. Points cluster in a lower-left-to-upper-right pattern, but with substantial vertical spread at nearly every X value, indicating that equity volume alone is a weak-to-moderate predictor of BTC price levels.
2. Strength, Direction, and Statistical Confidence
The correlation coefficient (r = 0.559) indicates a moderate positive relationship, with r² = 0.313 meaning only 31% of the variance in BTC's daily high is explained by equity market volume — leaving nearly 70% attributable to other factors. The 95% CI [0.468, 0.639] is reasonably tight and excludes zero, and the p-value (effectively 0) confirms this correlation is statistically robust, not due to chance, despite the noisy scatter. However, statistical significance with n=251 doesn't imply strong practical predictive power given the modest r².
Critically, the Granger causality tests show no significant predictive direction in either direction (X→Y: p=0.39; Y→X: p=0.25). This means neither series reliably "leads" the other in time — the contemporaneous correlation does NOT imply that equity volume changes forecast future BTC price movements, or vice versa. This is an important distinction: a real statistical association exists, but it appears to be a co-movement (likely driven by shared macro conditions) rather than a causal, tradable lead-lag relationship.
3. Notable Patterns and Outliers
Several data points stand out: observations like (39362, $14.2B), (41100, $14.8B), and (37545, $13.0B) show BTC highs well above the regression line at moderate X values, suggesting episodic decoupling — likely periods of crypto-specific volatility (e.g., FTX collapse, Terra/Luna crash, or macro risk-off events in 2022) where BTC price swung independently of equity volume. Conversely, many points near X=17,000–24,000 cluster tightly with Y in the $5-7B range, showing a more stable baseline relationship at lower equity volumes. The lower-left region appears denser and more linear, while the upper-right (higher equity volume) shows more dispersion, hinting at potential heteroscedasticity — variance in BTC price increases as equity trading activity rises.
4. Confounding Factors and Caveats
This correlation likely reflects shared macro drivers rather than direct causation: both equity markets and crypto markets in 2022 were heavily influenced by Fed rate hikes, inflation data, and broad risk-on/risk-off sentiment shifts. Equity volume itself is a noisy proxy — spikes can reflect index rebalancing, options expiration, or panic selling unrelated to crypto. Additionally, comparing a volume metric (Cboe) to a price metric (BTC high) mixes units conceptually — a cleaner comparison might use BTC volume vs. equity volume, or price vs. price. The 2022 window is also atypical (bear market, major crypto blowups), so results may not generalize to other periods.
5. Suggestions for Further Investigation
- Test with lagged/differenced data: Since Granger causality found no lead-lag effect at raw levels, consider testing returns (% change) rather than levels, which often reveals different dynamics than price/volume levels. - Introduce a common macro control variable (e.g., VIX, DXY, or Fed funds rate) to check if the correlation is spurious/mediated by shared macro exposure. - Segment by regime: Separate analysis for high-volatility windows (FTX collapse, Luna crash) vs. calmer periods to see if the r² changes materially. - Use like-for-like metrics: Compare equity volume to BTC volume (not price) for a more conceptually aligned relationship, or compare equity index price to BTC price.
X dataset: CryptoDataDownload – Binance BTC/USDT Daily OHLCV
Y dataset: Cboe U.S. Equities Historical Market Volume Data 2022
Part of experiment: Bitcoin - CryptoDataDownload – Binance BTC/USDT Daily OHLCV vs Cboe U.S. Equities Historical Market Volume Data 2022