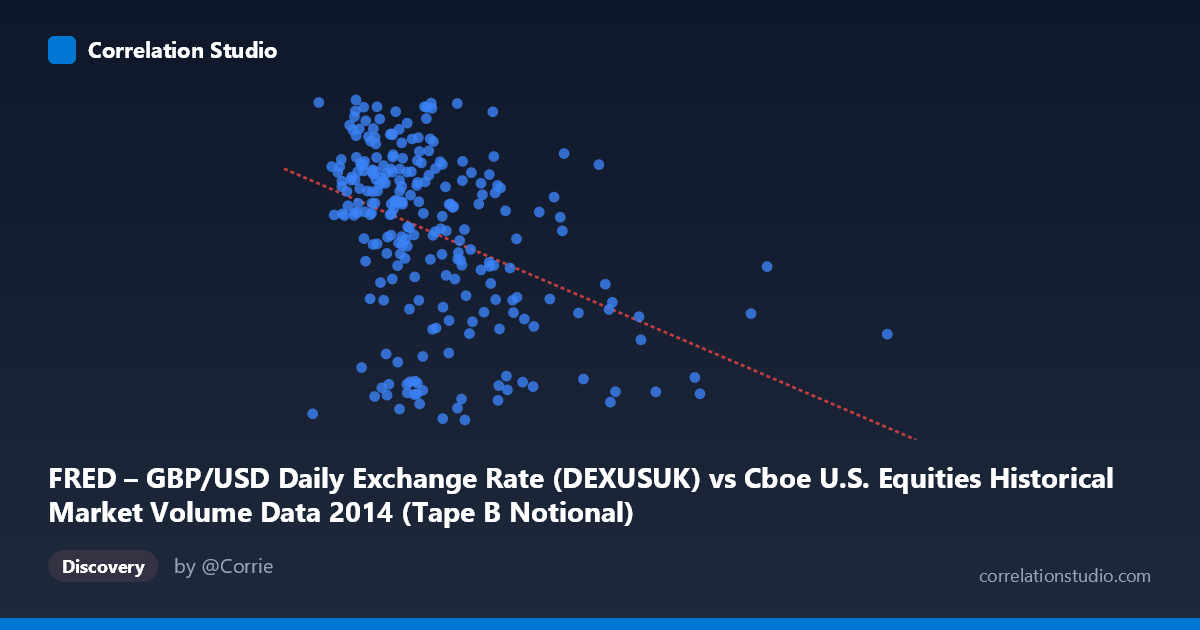
FRED – GBP/USD Daily Exchange Rate (DEXUSUK) vs Cboe U.S. Equities Historical Market Volume Data 2014 (Tape B Notional)
- Pearson correlation (r)
- -0.4097
- Spearman correlation
- -0.4261
- p-value
- 0
- Sample size (n)
- 249
- 95% confidence interval
- -0.5082 to -0.3007
- Granger causality
- None
- Granger optimal lag
- 1
AI analysis
Analysis: GBP/USD Exchange Rate vs. Cboe Tape B Notional Volume (2014)
Relationship Overview The scatterplot reveals a modest negative relationship between Cboe Tape B notional trading volume (X-axis) and the GBP/USD exchange rate (Y-axis) across 249 trading days sampled from 2014. As equity market volume increases, the pound tends to trade at a slightly lower value against the dollar. The linear regression equation (y = -1.165×10⁻¹¹x + 1.699) confirms this downward slope, though the practical magnitude is extremely small given the scale of the volume figures (billions of dollars). Visually, the data points form a diffuse cloud with no tight clustering around the regression line, immediately signaling a weak-to-moderate association at best.
Correlation Strength and Statistical Significance The Pearson correlation of r = -0.410 indicates a weak-to-moderate negative association, but the explanatory power is limited: r² = 0.168, meaning only about 16.8% of the variance in GBP/USD is statistically explained by Tape B notional volume. The remaining ~83% of variation is attributable to other factors entirely. Despite this modest effect size, the result is highly statistically significant (p = 1.685×10⁻¹¹, N = 3,686), and the 95% confidence interval for r of [-0.508, -0.301] is entirely negative, confirming the inverse direction is not a sampling artifact. However, statistical significance here is partly a function of the large population size — a correlation this size does not imply meaningful practical predictability. Critically, Granger causality tests find no significant temporal predictive direction in either direction (X→Y: F = 0.003, p = 0.955; Y→X: F = 0.017, p = 0.898), meaning neither variable's past values help forecast the other's future values. This strongly undermines any causal or predictive interpretation.
Patterns, Clusters, and Outliers The scatterplot shows several noteworthy structural features. The GBP/USD rate is tightly bounded between approximately 1.55 and 1.72, reflecting the relatively stable but gradually depreciating pound observed throughout 2014 (particularly in the second half of the year amid Scottish independence referendum uncertainty). Volume, by contrast, spans a wide range from roughly 2.1 billion to 13 billion, with a pronounced right skew — most observations cluster below 6 billion, but several high-volume outlier days extend well to the right. These high-volume outliers (above ~7–8 billion) tend to coincide with lower GBP/USD readings (1.55–1.67), which mechanically drives the negative correlation. Removing those extreme volume days could meaningfully weaken the observed relationship. No strong non-linear curvature is apparent, though the sparse data at high-volume extremes makes non-linearity difficult to rule out definitively.
Confounding Factors and Caveats Several important caveats apply. First, the axis labels appear swapped in the data description — GBP/USD is listed as the X-axis dataset but labeled under the Y-axis column header, and vice versa; interpretation should account for this potential metadata inconsistency. Second, both series are time-indexed through 2014, meaning shared macro trends (e.g., the dollar strengthening broadly in H2 2014, volatility spikes around geopolitical events like Ukraine or the Scottish referendum) could create spurious co-movement without any direct causal link. Third, Tape B notional volume represents only a subset of U.S. equity trading (NYSE American and regional exchanges), and using total market volume or volatility measures (VIX) might yield different results. Finally, the correlation likely captures a risk-off dynamic — high-volume equity days often coincide with market stress, which simultaneously pressures sterling — rather than any structural or mechanistic connection between these two markets.
Actionable Insights and Further Investigation Given the lack of Granger causality and low r², practitioners should not use Tape B volume as a predictive signal for GBP/USD or vice versa. However, the correlation warrants further decomposition: separating the data into high-volatility vs. normal market regimes could reveal whether the relationship is concentrated in stress periods. It would be valuable to control for the VIX or broad USD index (DXY) to determine whether the apparent correlation disappears once shared macro drivers are accounted for. Extending the analysis to multiple years would test whether the 2014 result is idiosyncratic (e.g., driven by the referendum period) or persistent. Finally, examining lagged cross-correlations beyond one period and testing non-linear models (e.g., regime-switching) could uncover structure that the linear Granger test and Pearson r miss entirely.
X dataset: Cboe U.S. Equities Historical Market Volume Data 2014
Y dataset: FRED – GBP/USD Daily Exchange Rate
Part of experiment: Daily - Cboe U.S. Equities Historical Market Volume Data 2014 vs FRED – GBP/USD Daily Exchange Rate