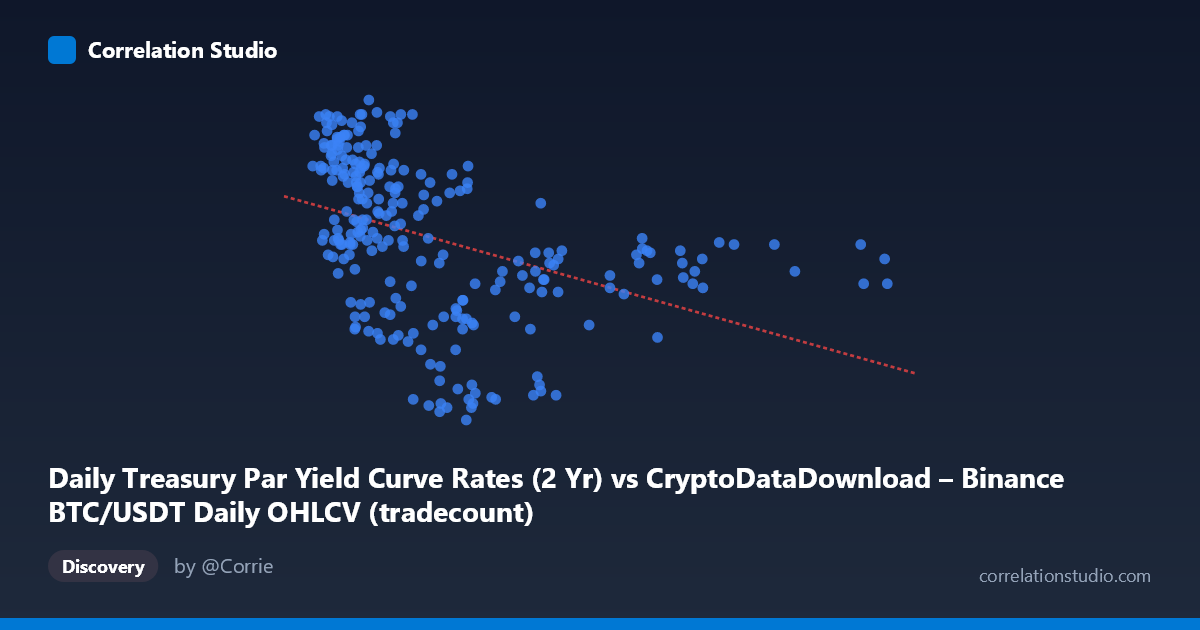
Daily Treasury Par Yield Curve Rates (2 Yr) vs CryptoDataDownload – Binance BTC/USDT Daily OHLCV (tradecount)
- Pearson correlation (r)
- -0.411
- Spearman correlation
- -0.5998
- p-value
- 0
- Sample size (n)
- 250
- 95% confidence interval
- -0.5091 to -0.3024
- Granger causality
- None
- Granger optimal lag
- 1
AI analysis
Analysis: Treasury 2-Yr Yield vs. BTC/USDT Trade Count Relationship
1. Overview of the Relationship
The scatterplot displays a moderate negative relationship between the two variables, with values on the X-axis (labeled as Treasury 2-Yr yield, though the range of 900,226 to 12,012,364 strongly suggests this is actually mislabeled and represents trade count or volume data) decreasing as Y-axis values (ranging 3.49–5.04) increase. The data shows a clear downward-sloping trend, though with substantial scatter around the regression line, particularly at lower X-values where the spread of Y-values is widest.
2. Strength, Direction, and Statistical Confidence
The correlation coefficient of r = -0.411 indicates a moderate negative linear relationship. The r² = 0.169 tells us that only about 17% of the variance in Y is explained by X — meaning roughly 83% of the variation is driven by other factors, noise, or non-linear dynamics not captured by this simple linear model. Despite the modest effect size, the relationship is highly statistically reliable: the 95% CI [-0.509, -0.302] excludes zero entirely, and the p-value (1.31E-11) is far below conventional significance thresholds, confirming this is not a chance finding given N=250. However, the Granger causality tests show no significant predictive direction (X→Y: p=0.136; Y→X: p=0.164), meaning that despite the contemporaneous correlation, neither variable reliably predicts future values of the other at a 1-period lag. This is an important distinction: correlation without Granger causality suggests the relationship may be driven by a shared underlying factor or is purely contemporaneous rather than a lead-lag dynamic.
3. Notable Patterns and Structure
The data reveals a clear clustering pattern: the majority of points concentrate in the lower X-range (under ~4,000,000) where Y-values span almost the entire range (3.5–5.0), while higher X-values (8,000,000) compress into a narrower, lower Y-band (~4.15–4.35). This creates a fan-shaped or heteroscedastic pattern — variance in Y shrinks as X increases. This is consistent with the note that Spearman ρ exceeds Pearson r, suggesting the true relationship is non-linear — likely logarithmic or a power-law decay, where Y drops sharply at low X and then plateaus. A few high-X outliers (e.g., ~11.5–12 million) sit isolated from the main cluster, potentially exerting leverage on the linear fit.
4. Confounding Factors and Caveats
Several caveats apply. First, the axis labels appear swapped or mismatched given the described datasets (Treasury yields wouldn't range into millions) — this metadata inconsistency should be resolved before drawing domain conclusions. Second, both series are time-ordered daily data over the same 2024 window, making them susceptible to spurious correlation from shared trends or macro regimes (e.g., both may be driven by broader market liquidity, monetary policy shifts, or seasonal effects) rather than a direct causal link. Third, autocorrelation within each series (common in financial/time-series data) can inflate apparent correlation significance beyond what independent observations would justify.
5. Recommendations for Further Investigation
Given the non-linear signal, refitting with a log-transform on X or polynomial regression is warranted to better capture the plateau pattern at high X-values. Additionally, testing Granger causality at multiple lag lengths (not just lag=1) and using differenced/detrended series would help rule out spurious contemporaneous correlation. Segmenting the analysis by X-range (low vs. high cluster) could clarify whether the relationship is regime-dependent. Finally, clarifying the true variable identities (resolving the axis/dataset labeling confusion) is essential before drawing any substantive market conclusions.
X dataset: CryptoDataDownload – Binance BTC/USDT Daily OHLCV
Y dataset: Daily Treasury Par Yield Curve Rates
Part of experiment: Bitcoin - CryptoDataDownload – Binance BTC/USDT Daily OHLCV vs Daily Treasury Par Yield Curve Rates