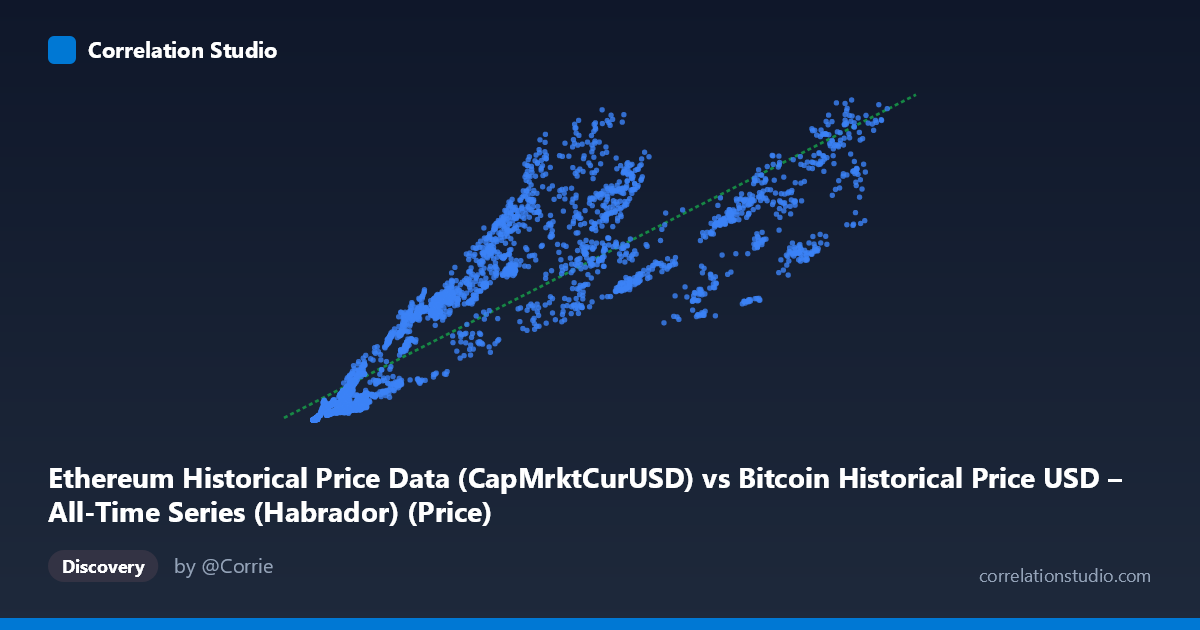
Ethereum Historical Price Data (CapMrktCurUSD) vs Bitcoin Historical Price USD – All-Time Series (Habrador) (Price)
- Pearson correlation (r)
- 0.88
- Spearman correlation
- 0.9496
- p-value
- 0
- Sample size (n)
- 3917
- 95% confidence interval
- 0.8727 to 0.8868
- Granger causality
- None
- Granger optimal lag
- 10
AI analysis
Analysis: Ethereum Market Cap vs. Bitcoin Price
1. Relationship Overview
The scatterplot shows a strong positive association between Ethereum's market capitalization (X) and Bitcoin's USD price (Y) across a nearly 11-year window (2015–2026). As Ethereum's market cap rises from near-zero (hundreds of dollars) to over $124,720M, Bitcoin's price climbs correspondingly from roughly $31M to $584B in the sampled scale. The data points trace a broadly linear, upward-sloping pattern, though with visible fanning (heteroscedasticity) at higher values, consistent with the two assets moving through shared bull/bear market cycles simultaneously rather than one directly driving the other on a fixed ratio.
2. Strength, Direction, and Statistical Confidence
The correlation coefficient (r = 0.88) indicates a strong positive linear relationship, with r² = 0.774 meaning approximately 77% of the variance in Bitcoin's price is statistically explained by Ethereum's market cap (or vice versa, since both are proxies for overall crypto market sentiment). The 95% CI [0.873, 0.887] is tight given the large sample (n=3,917), and the p-value of ~0 confirms this correlation is highly unlikely to be due to chance. However, correlation here should not be read as causation: the Granger causality tests show no significant predictive direction in either direction (X→Y: p=0.671; Y→X: p=0.838) even at an optimal lag of 10 periods. This strongly suggests that neither asset's price temporally leads the other in a forecastable way — instead, both series likely respond simultaneously to common macro drivers (crypto market sentiment, liquidity cycles, regulatory news, Bitcoin halving events).
3. Notable Patterns and Outliers
The data reveals clear non-linear clustering consistent with market cycle phases rather than steady growth. Early-period points (X < 5,000, Y < $30B) cluster tightly near the origin representing the 2015–2017 nascent market. A middle cluster (X: 10,000–30,000) shows more scatter and includes points where Y is disproportionately high relative to X (e.g., X=9,392 → Y=$68B; X=10,166 → Y=$106B), suggesting periods where Bitcoin rallied faster than Ethereum's cap grew — likely reflecting Bitcoin-specific catalysts (e.g., 2020–2021 institutional adoption phase) that temporarily decoupled the two. Conversely, high-X points (X100,000) show tighter clustering along the trend line, suggesting the relationship strengthens at market maturity/scale. The increasing spread of residuals at higher X values (heteroscedasticity) suggests the linear model underfits volatility at both extremes of the cycle.
4. Confounding Factors and Caveats
Several caveats apply. First, both variables are time series with strong autocorrelation — using standard Pearson r on trending time-series data can inflate apparent correlation strength since both series trend upward over calendar time regardless of any real interaction. Second, the "third variable" problem is significant here: overall crypto market liquidity, USD monetary policy, exchange volume, and speculative sentiment likely drive both assets simultaneously, making this a spurious or confounded correlation rather than a direct causal link. Third, Bitcoin halving cycles (roughly every 4 years) create structural breaks that a single linear model doesn't capture — the relationship may differ meaningfully across bull vs. bear regimes. Finally, the wide value range (spanning ~5 orders of magnitude) suggests a log-log transformation might reveal a more stable, homoscedastic relationship than the raw linear fit.
5. Recommendations for Further Investigation
Given the null Granger causality result, analysts should avoid using one asset's price to forecast the other in a lead-lag trading strategy — the data doesn't support directional predictability at any tested lag. Instead, treat both as co-moving indicators of broader "crypto market beta." Further work should: (1) re-run correlation/regression on log-transformed variables to address scale and heteroscedasticity issues; (2) apply cointegration tests (e.g., Johansen) rather than Granger on levels, since both series are likely non-stationary; (3) segment the analysis by market regime (bull/bear/halving cycles) to check for regime-dependent relationship strength; and (4) incorporate a third common-driver variable (e.g., total crypto market cap, USD liquidity index, or BTC dominance) to test whether it better explains the shared variance currently attributed to the X-Y relationship.
X dataset: Bitcoin Historical Price USD – All-Time Series (Habrador)
Y dataset: Ethereum Historical Price Data
Part of experiment: Bitcoin - Bitcoin Historical Price USD – All-Time Series (Habrador) vs Ethereum Historical Price Data