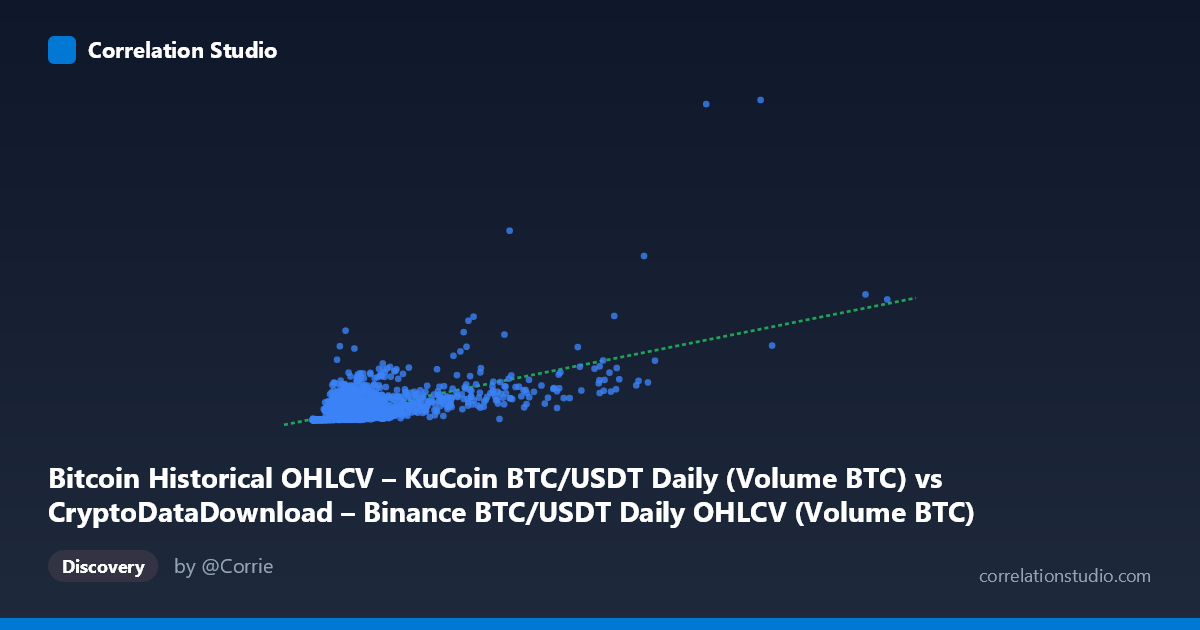
Bitcoin Historical OHLCV – KuCoin BTC/USDT Daily (Volume BTC) vs CryptoDataDownload – Binance BTC/USDT Daily OHLCV (Volume BTC)
- Pearson correlation (r)
- 0.6074
- Spearman correlation
- 0.6501
- p-value
- 0
- Sample size (n)
- 1861
- 95% confidence interval
- 0.5779 to 0.6353
- Granger causality
- None
- Granger optimal lag
- 10
AI analysis
Analysis: Binance vs. KuCoin BTC/USDT Daily Trading Volume
1. Relationship Overview
The scatterplot compares daily trading volume (in BTC) for the same asset pair (BTC/USDT) across two different exchanges — Binance and KuCoin — over a five-year span (2017–2022). Since both series measure conceptually the same thing (market activity in BTC/USDT), a positive relationship is expected: days with high overall market interest/volatility should drive volume up on both platforms simultaneously. The data confirms this, but the relationship is far from a tight 1:1 tracking — Binance volumes are consistently 1–2 orders of magnitude larger than KuCoin's, reflecting Binance's dominant market share.
2. Strength, Direction, and Uncertainty
The correlation (r = 0.607) is moderate-to-strong and positive, with r² = 0.369 indicating that only about 37% of the variance in KuCoin volume is explained by Binance volume — meaning 63% of the day-to-day variation is driven by factors unique to each exchange (localized trading activity, regional demand, KuCoin-specific events, etc.). The 95% CI [0.578, 0.635] is tight given the large sample (N=1,861), and the p-value of ~0 confirms this correlation is highly statistically significant — not due to chance. However, statistical significance here reflects sample size more than practical tightness of fit; the r² is the more meaningful number for judging how predictive one series is of the other.
Critically, the Granger causality test shows no significant predictive direction in either direction (X→Y and Y→X both p ≈ 0.59). This means neither exchange's volume history helps forecast the other's future volume beyond what's already known — the correlation is contemporaneous (same-day co-movement) rather than a lead-lag relationship. Practically, this suggests both series respond to the same external market shocks (e.g., BTC price swings, macro news) simultaneously, rather than one exchange's activity causing or foreshadowing the other's.
3. Patterns, Clusters, and Outliers
The data shows strong right-skew and heteroscedasticity: the majority of points cluster at low-to-moderate X values (under ~100,000 BTC), with a "fan" shape where Y's variance increases as X increases. A subset of outliers stands out — notably points like (207063.74, 40616.50) and (260313.08, 16905.78) — where KuCoin volume spikes disproportionately relative to Binance, suggesting episodic KuCoin-specific surges (potentially delistings, regional trading events, or arbitrage flows) not mirrored by Binance's typical volume ratio. The bulk of low-volume days (X < 30,000) show near-zero Y values, indicating quiet market periods are broadly quiet across both platforms, while high-volume days show more divergence — implying the relationship strengthens in magnitude but weakens in proportionality during high-activity periods.
4. Confounding Factors and Caveats
Several caveats apply. First, both series are driven by a common latent factor — actual BTC market volatility/price action — which likely explains most of the shared variance rather than any direct exchange-to-exchange interaction. Second, volume denominated "in BTC" conflates price and activity effects; a large BTC-denominated volume could reflect either high trade count or high BTC unit price shifts. Third, exchange-specific idiosyncrasies (fee changes, listing events, wash trading, API/data reporting differences) can create volume spikes unrelated to genuine market-wide activity, and KuCoin's much smaller scale makes it more susceptible to being skewed by a handful of large trades. Finally, the linear model (R²=0.369) likely understates a more appropriate log-log relationship, given the heavy right-skew in both variables (stdev exceeding or approaching the mean in both columns suggests non-normal, long-tailed distributions).
5. Suggestions for Further Investigation
- Re-run the analysis on log-transformed volumes (log X, log Y), which is standard for volume/financial data and likely to reveal a cleaner, more linear, and possibly stronger relationship. - Segment by market regime (bull vs. bear vs. sideways periods, or by year) to check whether the r²=0.37 is stable or driven by specific high-volatility windows (e.g., 2020–2021 bull run vs. 2022 crash). - Investigate the outlier days (e.g., the 207K/40K and 260K/17K points) individually against news/events calendars to identify whether they're KuCoin-specific anomalies or data artifacts. - Normalize volumes (e.g., as % of each exchange's own rolling average) to better isolate genuine co-movement in relative activity vs. absolute BTC volume dominance effects. - Given the null Granger result, don't use one exchange's volume as a forecasting signal for the other; instead, treat both as parallel, contemporaneously-correlated indicators of broader market conditions.
X dataset: CryptoDataDownload – Binance BTC/USDT Daily OHLCV
Y dataset: Bitcoin Historical OHLCV – KuCoin BTC/USDT Daily
Part of experiment: Bitcoin - CryptoDataDownload – Binance BTC/USDT Daily OHLCV vs Bitcoin Historical OHLCV – KuCoin BTC/USDT Daily