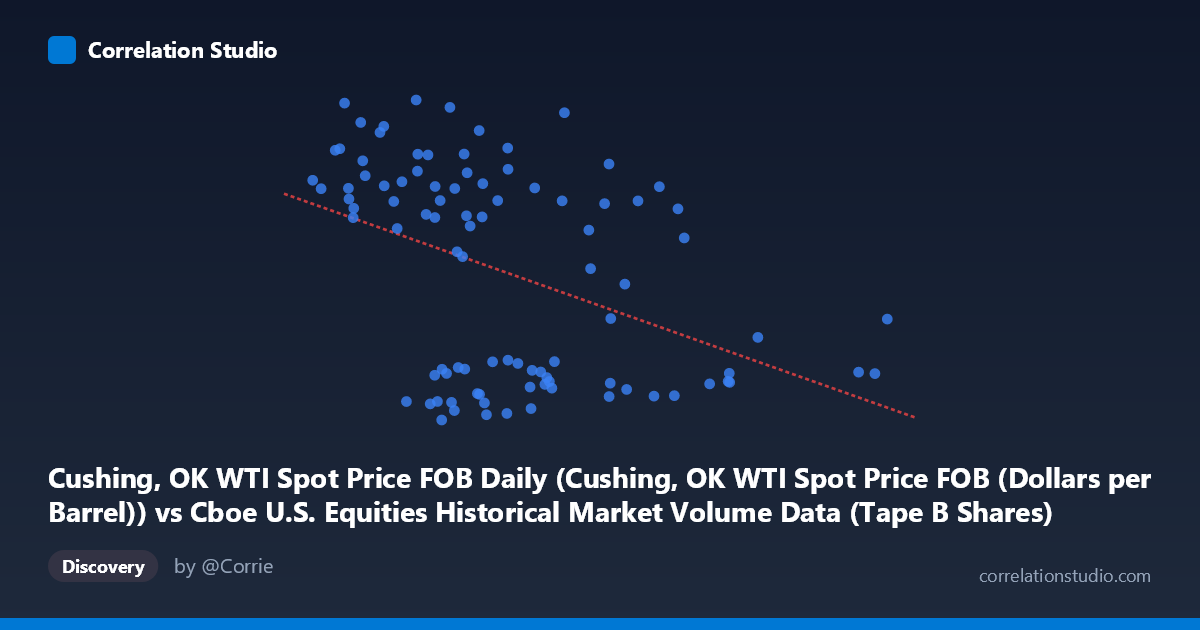
Cushing, OK WTI Spot Price FOB Daily (Cushing, OK WTI Spot Price FOB (Dollars per Barrel)) vs Cboe U.S. Equities Historical Market Volume Data (Tape B Shares)
- Pearson correlation (r)
- -0.4228
- Spearman correlation
- -0.4234
- p-value
- 0.000022
- Sample size (n)
- 94
- 95% confidence interval
- -0.5761 to -0.2408
- Granger causality
- None
- Granger optimal lag
- 1
AI analysis
Analysis: WTI Spot Price vs. Cboe Tape B Shares Volume
Relationship Overview
The scatterplot reveals a modest negative relationship between WTI crude oil spot prices (X-axis) and Cboe U.S. Equities Tape B share volume (Y-axis) over the January–May 2026 period. The linear regression equation (y = -1.454×10⁻⁷x + 115.45) indicates that as WTI prices increase, Tape B equity trading volume tends to decrease. Visually, the data exhibit a discernible downward trend, though with considerable scatter — points are broadly distributed across the plot rather than tightly clustered around the regression line, immediately signaling a relationship that is real but far from deterministic.
Correlation Strength and Statistical Significance
The Pearson correlation of r = -0.4228 indicates a moderate negative association, but the explanatory power is limited: r² = 0.1788 means only ~17.9% of the variance in Tape B volume is explained by WTI price levels, leaving over 82% attributable to other factors. The relationship is nonetheless statistically meaningful — the p-value of 2.18×10⁻⁵ is well below conventional thresholds, and the 95% confidence interval [-0.576, -0.241] excludes zero entirely, confirming the negative direction is not a sampling artifact. However, the Granger causality results are telling: neither direction shows significant temporal predictive power (X→Y: F=0.002, p=0.964; Y→X: F=0.033, p=0.857). This means that while the two variables co-vary statistically, neither reliably leads the other in time — the correlation reflects coincidence or shared external drivers rather than a directional causal mechanism.
Notable Patterns and Outliers
Several structural features stand out in the data. A visible clustering of high-volume observations (Y ≈ 95–115 barrels equivalent) concentrated at lower WTI price ranges (~$137M–$220M region) forms a distinct upper-left cluster, while a dense cluster of low-volume points populates the middle-to-upper X range (~$220M–$395M). A handful of notable outliers are present: the point near (393M, 74.5) represents the highest WTI price observation yet sits at only moderate volume, while points near (183M, 114.6) and (150M, 114.0) represent peak volume values at low prices. Points like (302M, 89.3) and (291M, 98.7) are elevated in volume relative to their price peers, suggesting the relationship is not uniform across price regimes.
Confounding Factors and Caveats
Several important caveats temper interpretation. First, the dataset label metadata appears to be swapped — the X-axis column is sourced from the Cboe volume dataset while being labeled as WTI price, and vice versa, which warrants verification before drawing firm conclusions. Second, equity market volume (Tape B covers NYSE American, NYSE Arca, and regional exchanges) is driven primarily by market volatility, macroeconomic events, algorithmic trading cycles, and investor sentiment — factors largely independent of crude oil pricing. The observed correlation may reflect a spurious or third-variable relationship: for instance, periods of macroeconomic stress could simultaneously depress oil prices and elevate defensive trading volume. The five-month window (Jan–May 2026) is also relatively short, limiting generalizability.
Actionable Insights and Further Investigation
Given the weak explanatory power and absent Granger causality, WTI prices alone are a poor predictor of Tape B volume and should not be used as a standalone signal. However, the statistically significant co-movement warrants further exploration. Recommended next steps include: (1) testing whether the relationship strengthens when conditioning on volatility regimes (VIX levels) or broad market drawdown periods; (2) extending the time series beyond five months to assess whether the r = -0.42 relationship is structurally stable or period-specific; (3) examining non-linear models (e.g., piecewise regression with a breakpoint around $220M) given the apparent clustering structure; and (4) verifying dataset column assignments to rule out a data pipeline error. The moderate correlation, while not actionable for prediction, could serve as a macro regime indicator when combined with additional variables.
X dataset: Cboe U.S. Equities Historical Market Volume Data
Y dataset: Cushing, OK WTI Spot Price FOB Daily
Part of experiment: Daily - Cboe U.S. Equities Historical Market Volume Data vs Cushing, OK WTI Spot Price FOB Daily