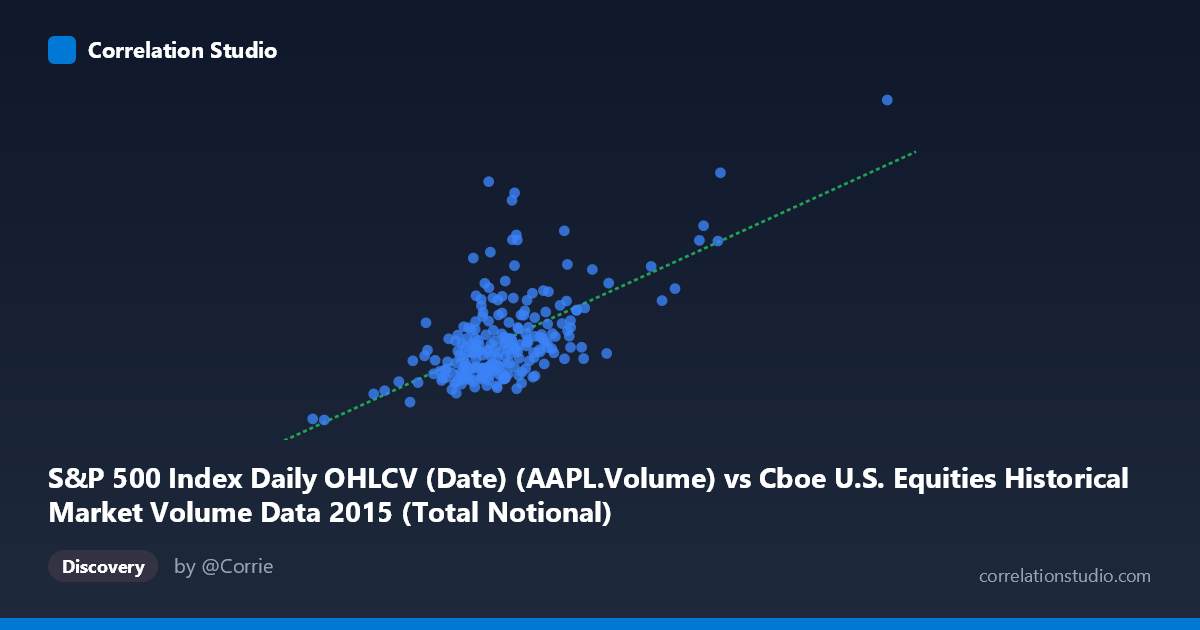
S&P 500 Index Daily OHLCV (Date) (AAPL.Volume) vs Cboe U.S. Equities Historical Market Volume Data 2015 (Total Notional)
- Pearson correlation (r)
- 0.6243
- Spearman correlation
- 0.5214
- p-value
- 0
- Sample size (n)
- 222
- 95% confidence interval
- 0.5367 to 0.6985
- Granger causality
- None
- Granger optimal lag
- 10
AI analysis
Analysis of AAPL Trading Volume vs. Cboe Total Notional Value (2015)
Relationship Overview The scatterplot reveals a moderate positive relationship between Apple Inc.'s daily trading volume (S&P 500 OHLCV data) and Cboe U.S. Equities total notional market value. As AAPL volume increases, total notional value on Cboe exchanges tends to rise as well. The linear regression equation (y = 0.00293831x − 11,693,300) captures this upward trend, though the scatter around the regression line is substantial, indicating that AAPL volume alone is far from a complete predictor of broader market notional activity. The relationship is broadly intuitive — AAPL is one of the most heavily traded and highest-capitalization securities in the U.S. equity market, so elevated AAPL activity often coincides with heightened overall market engagement.
Correlation Strength and Statistical Significance The Pearson correlation of r = 0.6243 indicates a moderate-to-strong positive association, but the explanatory power is more modest: R² = 0.3897, meaning AAPL volume accounts for roughly 39% of the variance in Cboe total notional value, leaving ~61% explained by other factors. The 95% confidence interval of [0.5367, 0.6985] is reasonably tight and does not approach zero, and the p-value of effectively 0 (across n = 222 paired observations) confirms this correlation is highly statistically significant and not a product of chance. However, statistical significance should not be conflated with practical or causal significance. Critically, the Granger causality tests yield no significant directional relationship in either direction (X→Y: F = 1.02, p = 0.42; Y→X: F = 0.65, p = 0.77), meaning that past AAPL volume does not help predict future Cboe notional value, and vice versa. This strongly suggests the correlation is contemporaneous and likely driven by shared underlying market conditions rather than one variable leading the other.
Notable Patterns, Clusters, and Outliers The bulk of observations cluster in the X range of roughly 15–27 billion (AAPL volume) and Y range of 25–80 million (total notional), forming a moderately dense core with visible positive slope. However, several notable outliers deserve attention. The point near (48.9B, 162.2M) is a dramatic high-leverage outlier, sitting far from the main cluster in both dimensions and likely corresponding to a specific high-volatility market event in 2015 (plausibly the late August 2015 market selloff). Similarly, the point near (8.1B, 13.0M) represents an extreme low-activity day at the opposite end. A third cluster of elevated Y-values (e.g., ~19.9B AAPL volume but ~124M notional) suggests days where broader market notional spiked independently of AAPL volume, hinting at non-AAPL-driven volatility events. These outliers likely exert disproportionate influence on the regression slope and the r value.
Confounding Factors and Caveats Several important caveats apply. First, broad market volatility regimes (e.g., the August 2015 correction, Fed rate decision periods) would simultaneously elevate both AAPL volume and market-wide notional, creating spurious co-movement. Second, there is a dataset labeling anomaly worth flagging: the axes appear to have the dataset column names swapped (AAPL Volume is listed as originating from the Cboe dataset, and Cboe Notional from the S&P 500 OHLCV dataset), which may indicate a data join or labeling error that should be verified before drawing firm conclusions. Third, AAPL's weight in indices and ETFs means its volume is partly mechanically linked to broad market flows. Finally, the optimal lag of 10 periods in the Granger test, despite non-significance, suggests some exploratory temporal structure worth probing at longer horizons.
Actionable Insights and Further Investigation Given that ~61% of variance remains unexplained, analysts should incorporate additional predictors — such as VIX levels, S&P 500 daily returns, or overall NYSE volume — to build a more complete model of Cboe notional activity. The August outlier event should be isolated and tested separately to assess whether the correlation holds in normal versus stressed market conditions, as regime-dependent correlations have significant implications for risk modeling. Investigating whether other mega-cap stocks (MSFT, GOOGL, AMZN) exhibit similar or stronger correlations with Cboe notional would help contextualize AAPL's unique role. Finally, the data labeling discrepancy between datasets should be audited to ensure the correct columns are being correlated, as misaligned joins could artificially inflate or deflate the observed r value.
X dataset: Cboe U.S. Equities Historical Market Volume Data 2015
Y dataset: S&P 500 Index Daily OHLCV (Date)
Part of experiment: Daily - Cboe U.S. Equities Historical Market Volume Data 2015 vs S&P 500 Index Daily OHLCV (Date)