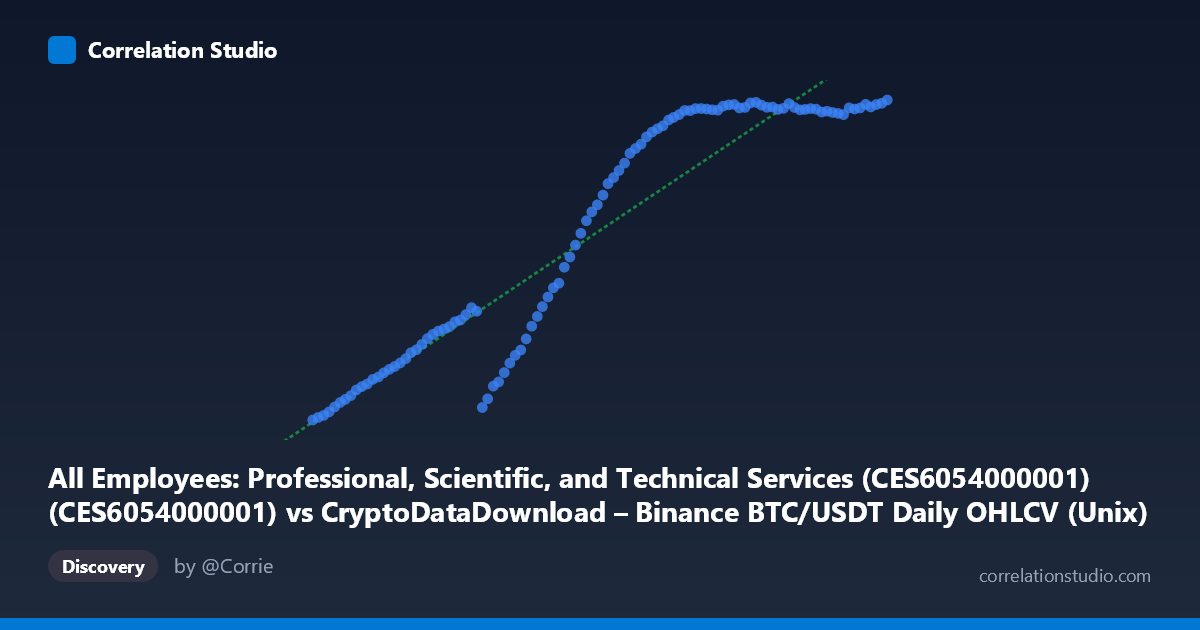
All Employees: Professional, Scientific, and Technical Services (CES6054000001) (CES6054000001) vs CryptoDataDownload – Binance BTC/USDT Daily OHLCV (Unix)
- Pearson correlation (r)
- 0.9396
- Spearman correlation
- 0.9368
- p-value
- 0
- Sample size (n)
- 106
- 95% confidence interval
- 0.9124 to 0.9586
- Granger causality
- None
- Granger optimal lag
- 10
AI analysis
Analysis: Professional Services Employment vs. BTC/USDT Price
1. What the Visualization Reveals
The scatterplot shows a strong, monotonic upward relationship between time-indexed values of professional/scientific/technical services employment (Y-axis) and BTC/USDT closing price (X-axis). Because both series are plotted against calendar time in this dataset structure, the "relationship" is really two independent trends—one in employment, one in crypto price—that happen to both rise over the 2017–2026 window. The scatter forms a fairly tight, slightly curved band rather than a loose cloud, indicating both series moved in the same direction with relatively few reversals.
2. Strength, Direction, and Statistical Caveats
The correlation is strong and positive (r = 0.94, R² = 0.884), meaning roughly 88% of the variance in one series is statistically explainable by the other. The 95% CI [0.913, 0.959] is narrow and excludes zero, and the p-value is effectively 0, confirming this is not a chance finding within the sample. However, the Granger causality tests are the critical caveat: neither direction shows significant predictive power (X→Y: p=0.59; Y→X: p=0.63) even at an optimal lag of 10 periods. This strongly suggests the correlation is not causal in a temporal-leading sense—neither employment growth predicts BTC price movements nor vice versa. Instead, both series likely share a common driver: long-run secular growth (time itself, broad economic expansion, or a shared macro trend like post-2020 recovery and monetary conditions).
3. Notable Patterns and Non-linearities
Several features stand out: - Two-regime structure: Y values cluster near ~9,100–9,700 for X (BTC prices) below ~$45,000, then jump to a compressed ~10,400–10,820 band for X above ~$45,000. This suggests employment data plateaus while BTC price continued climbing, producing a concave/logarithmic-looking curve rather than a straight line. - Ceiling effect on Y: Employment values barely move (10,750–10,820) across a wide range of BTC prices ($65k–$111k+), indicating diminishing sensitivity—consistent with real-world employment being far more stable/bounded than crypto price volatility. - 2020–2021 inflection: A cluster of mid-range values (~10,044–10,450) corresponds to the BTC bull run and pandemic-era employment rebound, marking a transition zone. - No clear outliers exist because the smooth thematic progression (monthly employment vs. daily price sampled at same dates) constrains scatter.
4. Confounding Factors
This is a textbook spurious correlation via shared time trend. Both series are strongly autocorrelated and trending upward over an 8+ year window; virtually any two non-stationary time series with upward drift will show high linear correlation. Key confounds: - Non-stationarity: Neither series is differenced/detrended, inflating r artificially. - Mismatched frequencies: Monthly employment data compared to daily crypto prices means many Y-values repeat across multiple X-values (visible as vertical clustering), which can distort correlation strength. - No plausible economic mechanism: Professional services hiring is not meaningfully driven by BTC price at daily granularity, and BTC price is not driven by monthly labor statistics—the Granger results confirm this.
5. Recommendations
Treat this correlation as descriptive, not causal or predictive. For genuine insight: (a) difference or detrend both series (e.g., % change month-over-month) and re-test correlation—this will likely collapse toward zero; (b) test against a shared covariate like the Fed funds rate, M2 money supply, or a general market index (S&P 500) to identify the true common driver; (c) avoid using this pairing for forecasting given the null Granger results. The high R² here is a caution against naive correlation-hunting across unrelated economic and financial time series.
X dataset: CryptoDataDownload – Binance BTC/USDT Daily OHLCV
Y dataset: All Employees: Professional, Scientific, and Technical Services (CES6054000001)
Part of experiment: Bitcoin - CryptoDataDownload – Binance BTC/USDT Daily OHLCV vs All Employees: Professional, Scientific, and Technical Services (CES6054000001)