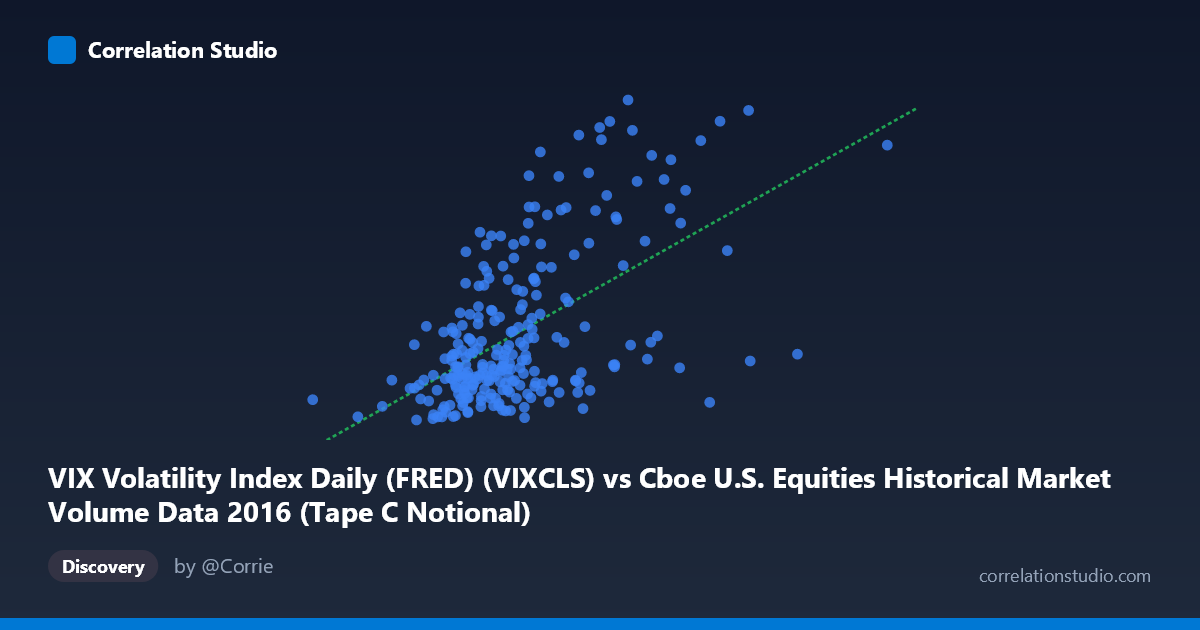
VIX Volatility Index Daily (FRED) (VIXCLS) vs Cboe U.S. Equities Historical Market Volume Data 2016 (Tape C Notional)
- Pearson correlation (r)
- 0.5616
- Spearman correlation
- 0.4907
- p-value
- 0
- Sample size (n)
- 252
- 95% confidence interval
- 0.4707 to 0.6407
- Granger causality
- None
- Granger optimal lag
- 1
AI analysis
Analysis: VIX Volatility Index vs. Cboe Tape C Notional Volume (2016)
Relationship Overview The scatterplot reveals a moderate positive relationship between the VIX Volatility Index and Tape C notional trading volume across U.S. equities exchanges in 2016. As the VIX rises — indicating higher market fear and uncertainty — notional trading volume on Tape C tends to increase as well. This aligns with well-established market intuition: volatile markets drive heightened trading activity as investors reposition, hedge, and react to price swings. The linear regression equation (y = 1.957×10⁻⁹x + 6.077) confirms a positive slope, though the extremely small coefficient reflects the vastly different scales of the two variables (X values in the billions).
Correlation Strength and Statistical Significance With r = 0.5616, the relationship is moderate in strength and positive in direction. However, the coefficient of determination r² = 0.3154 is the more sobering metric: only 31.5% of the variance in Tape C notional volume is explained by VIX levels, meaning the majority of volume variation is driven by other factors entirely. The 95% confidence interval of [0.4707, 0.6407] is reasonably tight given n=252, and the p-value ≈ 0 confirms this correlation is highly unlikely to be a chance finding in the sample. That said, the Granger causality tests reveal no significant temporal predictive relationship in either direction (X→Y: F=0.471, p=0.493; Y→X: F=1.265, p=0.262). This is a critical nuance — while the two variables co-move contemporaneously, knowing yesterday's VIX does not statistically improve predictions of today's volume, and vice versa, at the tested lag of 1 period.
Notable Patterns, Clusters, and Outliers The scatterplot shows a distinct dense cluster of observations in the lower-left region, roughly where X (notional volume) falls between ~3.5–6.0 billion and VIX values cluster between 11–18. This represents the "normal market" regime that dominated much of 2016. Several notable outliers are visible in the upper-right quadrant — particularly the points near (6,246M, 26.69) and (7,312M, 22.42) and (5,174M, 24.15) — which likely correspond to specific high-volatility events such as the Brexit vote (June 2016) or the U.S. presidential election (November 2016). There also appear to be high-volume, low-VIX observations (e.g., ~6.7B notional at VIX ~15.2) suggesting that volume can surge without corresponding fear spikes, potentially during momentum-driven rallies or index rebalancing events.
Confounding Factors and Caveats Several important caveats apply. First, the Granger non-causality finding warns against any causal interpretation — contemporaneous correlation does not establish a lead-lag mechanism. Second, Tape C specifically covers NYSE Arca-listed securities, meaning this relationship may not generalize to Tape A or B, or total market volume. Third, the VIX is forward-looking (it reflects 30-day implied volatility), while notional volume is a realized same-day measure — comparing these across temporal horizons introduces conceptual misalignment. Fourth, 2016 was an unusual year containing the Brexit referendum, U.S. election, and Federal Reserve policy shifts, meaning the correlation structure observed may not replicate in calmer or differently stressed years. Finally, seasonality and day-of-week effects could be confounding both series simultaneously, inflating the apparent correlation.
Actionable Insights and Further Investigation Practitioners could explore whether intraday VIX spikes (rather than daily closing values) provide stronger same-day volume predictions, which would be more operationally useful for liquidity management. It would be valuable to segment the analysis by market regime — testing whether the VIX–volume relationship strengthens materially above a VIX threshold of ~20, given the outlier clustering visible in the chart. The Granger non-causality result suggests researchers should extend the lag window beyond 1 period to test for longer-horizon predictability, or employ a Vector Autoregression (VAR) framework capturing multivariate dynamics. Additionally, controlling for known event dates (Brexit, FOMC meetings, earnings seasons) as dummy variables in a regression would help isolate the pure VIX-volume relationship from event-driven co-movement, producing a cleaner signal for trading and risk management applications.
X dataset: Cboe U.S. Equities Historical Market Volume Data 2016
Y dataset: VIX Volatility Index Daily (FRED)
Part of experiment: Daily - Cboe U.S. Equities Historical Market Volume Data 2016 vs VIX Volatility Index Daily (FRED)