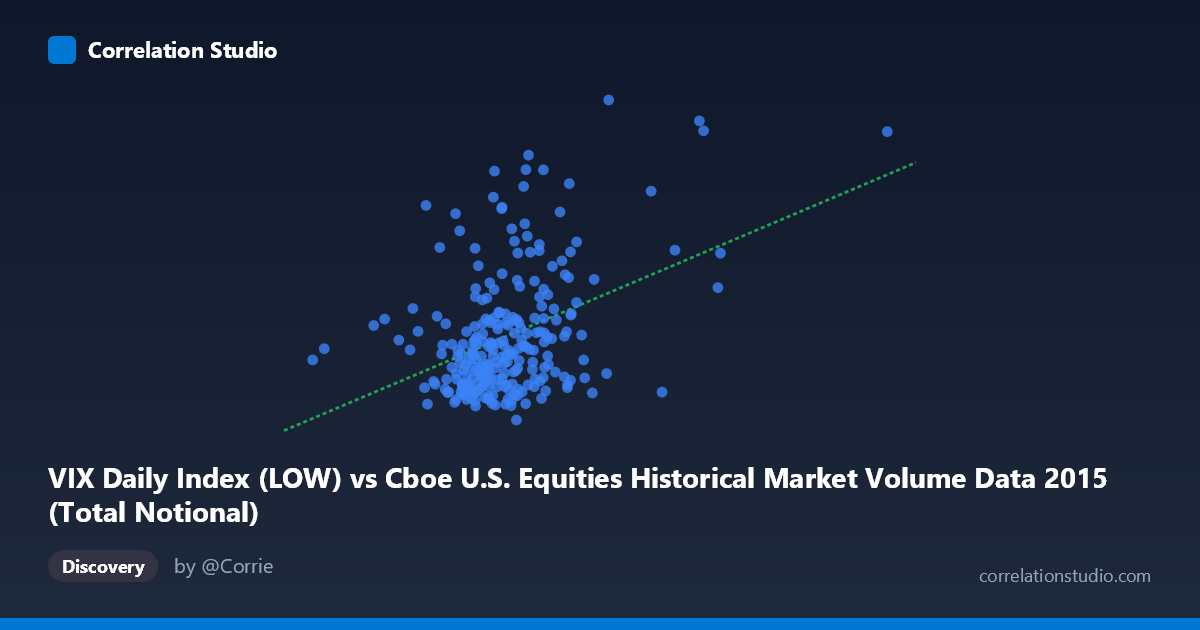
VIX Daily Index (LOW) vs Cboe U.S. Equities Historical Market Volume Data 2015 (Total Notional)
- Pearson correlation (r)
- 0.4051
- Spearman correlation
- 0.3056
- p-value
- 0
- Sample size (n)
- 252
- 95% confidence interval
- 0.2964 to 0.5035
- Granger causality
- None
- Granger optimal lag
- 1
AI analysis
Analysis: VIX Total Notional vs. Cboe Market Volume (VIX Low Index), 2015
1. Overall Relationship Revealed
The scatterplot reveals a modest positive relationship between the Cboe U.S. Equities Historical Market Volume (VIX Low Index, X-axis) and the VIX Daily Index Total Notional values (Y-axis) across 252 trading days in 2015. As market volume increases, VIX notional values tend to rise, which is intuitively consistent with the idea that higher trading activity often coincides with elevated volatility or uncertainty. However, the relationship is far from tight — the data points are broadly dispersed across the plot, with no clearly defined linear band, suggesting that volume alone is a weak predictor of volatility-linked notional values.
2. Correlation Strength, Direction, and Temporal Predictive Power
The correlation coefficient of r = 0.4051 indicates a weak-to-moderate positive association. More importantly, r² = 0.1641 reveals that only about 16.4% of the variance in Y is explained by X, meaning roughly 84% of variation in VIX Total Notional values is driven by factors entirely outside this relationship. The 95% confidence interval of [0.2964, 0.5035] confirms the correlation is reliably positive and non-trivial, and the highly significant p-value of 2.256×10⁻¹¹ rules out chance as an explanation — this signal is statistically real. Nevertheless, the Granger causality results are striking in their clarity: neither direction shows significant temporal predictive power (X→Y: F=0.2501, p=0.6175; Y→X: F=0.1181, p=0.7314). This means that despite the contemporaneous correlation, past values of market volume do not help predict future VIX notional values, and vice versa. The relationship is associative rather than directionally causal on a day-to-day lag basis.
3. Notable Patterns, Clusters, and Outliers
The bulk of the data is concentrated in the X range of approximately 15–27 billion, with Y values clustering between roughly 11 and 22, forming a dense central mass. However, several notable outliers are visible at the upper extremes: points near (35.6B, 28.08) and (36.8B, 20.80) sit far to the right, suggesting episodic spikes in market volume. The point near (7.2B, 14.45) is a clear low-volume outlier on the far left. There are also high-Y outliers at moderate X values — for example, (20.4B, 25.68) and (25.8B, 24.94) — where volatility-linked notional surged without correspondingly extreme volume, hinting at non-linear or regime-driven dynamics. The regression line (y = 3.48×10⁻¹⁰x + 8.46) fits poorly in these extreme regions, suggesting the relationship may be heteroscedastic or subject to threshold effects.
4. Confounding Factors and Caveats
Several important caveats apply. First, 2015 was a year with distinct volatility regimes — particularly the August 2015 "China shock" market selloff, which produced both extreme VIX spikes and volume surges simultaneously. These events may be driving much of the observed correlation without representing a stable structural relationship. Second, the axis assignment appears counterintuitive: the "VIX Low Index" (a volatility measure) is plotted on the X-axis as a proxy for market volume, while a market volume dataset column is on the Y-axis — this inversion of variable roles warrants careful re-examination of the data joining logic. Third, the N=3,302 population versus n=252 sample suggests daily data for a single year; the correlation may not generalize across years with different volatility environments. Finally, common macro drivers — such as geopolitical events, Federal Reserve announcements, and earnings seasons — likely influence both variables simultaneously, inflating the apparent correlation through shared confounds.
5. Actionable Insights and Further Investigation
Given the weak explanatory power and absence of Granger causality, this correlation should not be used for predictive modeling in isolation. Practitioners should consider: (1) extending the time series beyond 2015 to test whether r² remains stable across different volatility regimes; (2) segmenting the data by market event type (e.g., earnings seasons, Fed meeting days, macro shock events) to determine whether the correlation strengthens in specific contexts; (3) exploring non-linear models (e.g., threshold regression or regime-switching models) given the visual evidence of clustering and outlier behavior; and (4) investigating the data column assignments to confirm that the VIX Low Index and Total Notional fields are being compared as intended, since the dataset-column pairing described suggests a potential metadata mismatch worth resolving before drawing further conclusions.
X dataset: Cboe U.S. Equities Historical Market Volume Data 2015
Y dataset: VIX Daily Index
Part of experiment: Daily - Cboe U.S. Equities Historical Market Volume Data 2015 vs VIX Daily Index