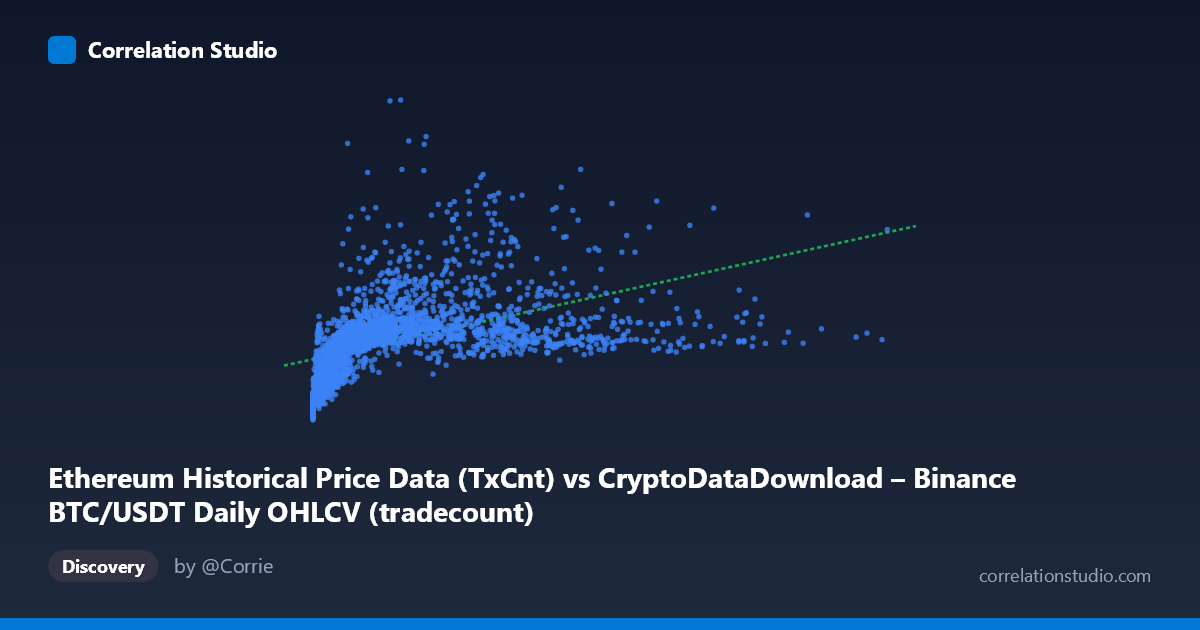
Ethereum Historical Price Data (TxCnt) vs CryptoDataDownload – Binance BTC/USDT Daily OHLCV (tradecount)
- Pearson correlation (r)
- 0.4927
- Spearman correlation
- 0.7665
- p-value
- 0
- Sample size (n)
- 3191
- 95% confidence interval
- 0.4659 to 0.5185
- Granger causality
- None
- Granger optimal lag
- 10
- Time coverage
- 2017-08-17 to 2026-05-20
AI analysis
Analysis: Ethereum TxCnt vs. BTC/USDT Tradecount
1. Relationship Overview
The scatterplot depicts a moderate positive association between Ethereum transaction counts (X) and Binance BTC/USDT daily trade counts (Y). The data reveals a classic heteroscedastic "fan" pattern: at low X values (roughly under 1M), Y is tightly clustered between 600,000–1,400,000, but as X increases, the spread in Y widens considerably, with some high-X points still exhibiting mid-range Y values while others reach 2M+. This is characteristic of a relationship that is real but far from deterministic, with substantial unexplained variance at higher X values.
2. Strength, Direction, and Uncertainty
The Pearson correlation of r = 0.4927 indicates a moderate positive linear relationship, but r² = 0.2427 tells the more important story: only ~24% of the variance in Y is explained by X, leaving over three-quarters of Y's variability attributable to other factors. The 95% CI [0.4659, 0.5185] is tight, and the p-value of effectively 0 confirms this correlation is statistically robust given the large sample (n=3,191) — but statistical significance here should not be conflated with practical predictive strength. Critically, the Granger causality test shows no significant temporal predictive direction in either direction (X→Y: p=0.43; Y→X: p=0.54). This means that despite the contemporaneous correlation, neither series reliably helps forecast future values of the other — the relationship is likely driven by a shared underlying trend (e.g., overall crypto market growth/activity cycles) rather than one metric causally leading the other.
3. Notable Patterns and Outliers
Several features stand out: - Extreme X outlier: one point near X=15.36M dwarfs the rest of the range (mean X is only ~1.97M), suggesting either a data anomaly or an exceptional network activity spike that will heavily leverage any regression fit. - Low-X cluster: many points sit near X<20,000 with Y ranging widely (295K–1.08M), suggesting Y has a substantial baseline/floor independent of X. - Fan-shaped variance: the spread of Y increases with X, violating the homoscedasticity assumption of simple linear regression — this is visually and statistically consistent with the note that Spearman ρ exceeds Pearson r, implying a non-linear (log or power-law) relationship may fit better than the straight line y = 0.087x + 898,712.
4. Confounding Factors and Caveats
Both series are time-stamped crypto metrics spanning 2017–2026, a period marked by massive bull/bear cycles, exchange listing changes, and shifting retail participation. Any correlation between two crypto-market metrics over this span is highly susceptible to spurious correlation via shared macro trends (e.g., both series trending upward during bull markets and cratering during crashes) rather than a direct mechanical link between Ethereum network usage and Binance BTC trading activity. Additionally, mixing "TxCnt" (an on-chain metric) with "tradecount" (an exchange-specific metric) means structural breaks — halving cycles, fee market changes (EIP-1559), Binance's evolving market share, and regulatory events — could each independently shift the series without any real interaction between them.
5. Actionable Insights
Given the low R² and lack of Granger causality, this pairing should not be used for predictive trading models without much stronger justification or additional lagged/exogenous variables. Recommended next steps: (1) detrend or difference both series (e.g., using returns/percent changes) before re-testing correlation and causality, since raw levels of two crypto growth metrics will spuriously correlate due to common trend; (2) test log-transformed variables given the fan-shaped scatter and the Spearman Pearson signal, which may substantially improve fit; (3) segment by market regime (bull/bear/sideways) to check if the relationship strengthens or weakens under different conditions; and (4) investigate the extreme X outlier for data integrity before drawing further conclusions.
X dataset: CryptoDataDownload – Binance BTC/USDT Daily OHLCV
Y dataset: Ethereum Historical Price Data
Part of experiment: Bitcoin - CryptoDataDownload – Binance BTC/USDT Daily OHLCV vs Ethereum Historical Price Data