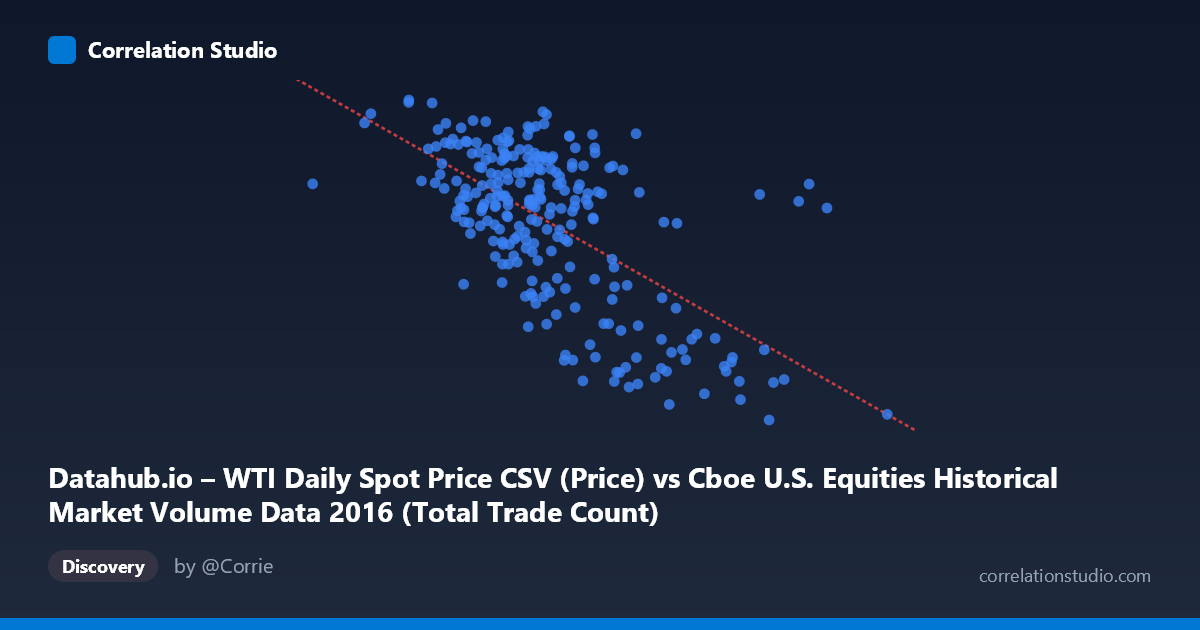
Datahub.io – WTI Daily Spot Price CSV (Price) vs Cboe U.S. Equities Historical Market Volume Data 2016 (Total Trade Count)
- Pearson correlation (r)
- -0.6234
- Spearman correlation
- -0.5269
- p-value
- 0
- Sample size (n)
- 252
- 95% confidence interval
- -0.6936 to -0.5416
- Granger causality
- None
- Granger optimal lag
- 1
AI analysis
Analysis: WTI Oil Price vs. U.S. Equity Market Trade Count (2016)
Relationship Overview The scatterplot reveals a moderate negative relationship between WTI crude oil daily spot prices (X-axis) and total U.S. equity market trade counts (Y-axis) across 252 trading days in 2016. As oil prices rise, equity trade counts tend to decline, and conversely, lower oil prices coincide with higher trading activity. The linear regression equation (y = -7.94×10⁻⁶x + 62.53) confirms this inverse slope, with the practical implication that for every roughly 125,000-unit increase in the oil price proxy variable, trade counts decrease by approximately one unit. The relationship is visually apparent but clearly imperfect, with substantial scatter around the regression line, suggesting that while a systematic pattern exists, many other forces are simultaneously shaping trading volume.
Correlation Strength and Statistical Significance The Pearson correlation of r = -0.623 indicates a moderate-to-strong negative association, and the R² of 0.389 means that approximately 38.9% of the variance in equity trade counts is explained by oil price variation alone — a meaningful but far from complete explanatory relationship, leaving over 61% of variance attributable to other factors. The 95% confidence interval of [-0.694, -0.542] is notably tight and entirely negative, providing strong statistical confidence that the true population correlation is genuinely inverse and non-trivial in magnitude. The p-value of essentially zero (given N = 3,622) confirms this is not a chance finding. However, the Granger causality tests are unambiguous in their null result — neither direction (X→Y: F = 0.495, p = 0.482; Y→X: F = 1.060, p = 0.304) achieves significance at conventional thresholds. This is a critical caveat: while a contemporaneous correlation exists, oil prices do not temporally predict trade counts at the next period's lag, and vice versa, meaning the relationship lacks predictive temporal directionality.
Patterns, Clusters, and Outliers Several structural features stand out in the data. A distinct lower-right cluster of points (high X values ~3.3M–4.5M, low Y values ~26–34) appears to represent high-price oil periods with depressed trading activity, forming a somewhat separate grouping from the main cloud. The bulk of observations cluster in the X range of roughly 1.9M–2.7M, where Y values span a wide range (~37–52), producing the core of the negative trend. A few high-Y outliers (~50–54 trade count range) appear at relatively low-to-mid X values, suggesting episodic surges in trading activity that deviate from the general trend. The sample points confirm this heteroscedasticity — variance in Y appears larger at mid-range X values and compresses at the extremes, hinting at a potentially non-linear or bounded relationship rather than a clean linear one.
Confounding Factors and Interpretive Caveats Several important caveats apply. First, 2016 was a highly unusual year — oil prices recovered from multi-year lows (~$26/barrel in February) to ~$54 by year-end, coinciding with OPEC production cut announcements and U.S. election volatility, all of which independently drove equity market trading surges. This means oil price here may be acting as a proxy for broader macroeconomic uncertainty and risk sentiment rather than having any direct mechanical link to trade counts. Second, the dataset labels appear swapped in the axis descriptions (X is labeled as a volume/price dataset while Y references oil price metadata), warranting verification before drawing firm conclusions. Third, seasonal effects in equity trading (year-end rebalancing, lower summer volumes) could create spurious correlation with oil's seasonal price patterns. Finally, the lack of Granger causality underscores that any correlation is likely driven by a common third factor — such as macroeconomic risk appetite, volatility indices (VIX), or Federal Reserve policy signals — rather than a direct causal pathway.
Actionable Insights and Further Investigation The most productive next step would be to introduce VIX or broader market volatility as a control variable, testing whether the oil-trade count correlation persists after accounting for risk sentiment. Researchers should also examine the time series structurally — plotting both variables over the 2016 calendar year may reveal whether the correlation is driven by a shared trend (both responding to the oil price recovery narrative) rather than a true cross-sectional relationship. A non-linear regression or spline fit may better capture the apparent clustering at extremes. Additionally, subsetting by exchange type within the Cboe dataset could reveal whether the correlation is concentrated in specific venue types (e.g., dark pools vs. lit exchanges), which would carry distinct market microstructure implications. Finally, extending the analysis beyond 2016 to multiple years would test whether this relationship is a durable structural feature or an artifact of one exceptional market year.
X dataset: Cboe U.S. Equities Historical Market Volume Data 2016
Y dataset: Datahub.io – WTI Daily Spot Price CSV
Part of experiment: Daily - Cboe U.S. Equities Historical Market Volume Data 2016 vs Datahub.io – WTI Daily Spot Price CSV