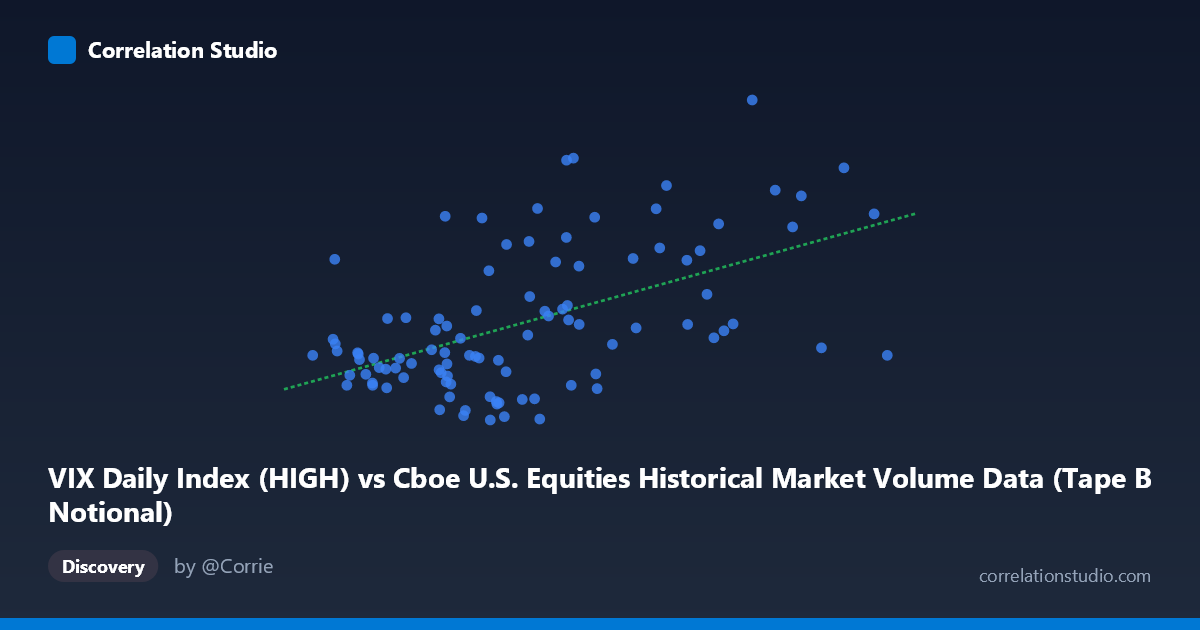
VIX Daily Index (HIGH) vs Cboe U.S. Equities Historical Market Volume Data (Tape B Notional)
- Pearson correlation (r)
- 0.5303
- Spearman correlation
- 0.4791
- p-value
- 0
- Sample size (n)
- 99
- 95% confidence interval
- 0.3718 to 0.6587
- Granger causality
- None
- Granger optimal lag
- 1
AI analysis
Scatterplot Analysis: VIX Daily Index (HIGH) vs. Tape B Notional Volume
Overall Relationship
The scatterplot reveals a moderate positive relationship between the VIX Daily Index High values and Cboe U.S. Equities Tape B Notional trading volume over the January–May 2026 period. As VIX High readings increase (ranging from ~7.1B to ~21.0B on the x-axis), Tape B Notional volume tends to rise correspondingly, consistent with the well-established market intuition that elevated volatility regimes attract higher trading activity. The linear regression equation (y = 7.24×10⁻¹⁰x + 12.49) confirms this positive slope, though the relationship is far from deterministic, with considerable scatter throughout the plot.
Correlation Strength and Statistical Significance
The Pearson correlation of r = 0.53 indicates a moderate positive association, but the coefficient of determination (r² = 0.281) tells a more sobering story: only ~28% of the variance in Tape B Notional volume is explained by VIX High levels, leaving roughly 72% attributable to other factors. The 95% confidence interval for r spans [0.37, 0.66], which is meaningfully wide — reflecting genuine uncertainty even with n = 99 paired observations drawn from N = 1,980. The p-value of 1.65×10⁻⁸ confirms the correlation is highly unlikely to be a chance finding, so the signal is real, but modest in practical explanatory power. Critically, Granger causality tests find no significant directional predictive relationship in either direction (X→Y: F = 0.41, p = 0.52; Y→X: F = 0.0002, p = 0.99), meaning neither variable meaningfully predicts the other in a temporally lagged sense at the one-period lag tested. This distinguishes statistical co-movement from actionable lead-lag forecasting.
Notable Patterns, Clusters, and Outliers
Several features stand out upon closer inspection of the data:
- A dense central cluster between VIX values of roughly 8.0B–13.0B and Tape B Notional of 15–23 constitutes the bulk of observations, suggesting most trading days fall within a "normal volatility, normal volume" regime. - A handful of high-VIX, high-volume outliers in the upper-right region (e.g., VIX ≈ 17.7B with Tape B ≈ 35.30; VIX ≈ 18.9B with Tape B ≈ 29.28; VIX ≈ 19.9B with Tape B ≈ 31.04) appear to exert substantial leverage on the regression line and likely inflate the correlation coefficient. - Anomalous low-volume readings at high VIX are also present — notably the observation at VIX ≈ 21.0B with Tape B ≈ 19.27, which runs sharply counter to the trend and warrants individual investigation. - Vertical spread is substantial across most VIX ranges, confirming that VIX level alone is a weak predictor of any single day's Tape B volume.
Confounding Factors and Caveats
Several important caveats apply to interpreting this correlation:
1. Dataset labeling ambiguity: The axis labels appear to be swapped in the source metadata — the X-axis is described as "VIX Daily Index (HIGH)" from the Market Volume dataset, and the Y-axis as "Tape B Notional" from the VIX dataset, which likely reflects a metadata inversion. Interpretations should be verified against raw data sources. 2. Short time window: Five months (Jan–May 2026) is a narrow window that may capture a single volatility regime (e.g., a specific macro event cluster), making generalization to other periods unreliable. 3. Temporal autocorrelation: Both VIX and equity volume exhibit strong serial correlation; treating daily observations as independent inflates effective sample size and understates true uncertainty in the correlation estimate. 4. Outlier sensitivity: The upper-right extreme points appear to disproportionately drive the moderate correlation; removing 3–4 of these observations would likely reduce r substantially. 5. Omitted variables: Earnings seasons, Fed policy announcements, index rebalancing events, and market structure changes (e.g., payment for order flow shifts) all independently affect Tape B volume regardless of VIX levels.
Actionable Insights and Further Investigation
Given these findings, several next steps are warranted. Regime-segmented analysis — separating low-VIX (< 20), moderate (20–30), and high ( 30) environments — would clarify whether the correlation is driven primarily by stress episodes. Rolling correlation analysis across the full N = 1,980 population would reveal whether the relationship is stable over time or episodic. Since Granger causality is absent at lag-1, testing longer lags (2–5 periods) may uncover delayed transmission effects. Additionally, a multivariate model incorporating factors such as S&P 500 daily returns, options expiration calendars, and macro event dummies would likely substantially improve explanatory power beyond the 28% achieved here. Finally, the outlier at (20.97B, 19.27) deserves a data quality review, as it may represent a data error, holiday-affected session, or a genuine structural break worth understanding on its own terms.
X dataset: Cboe U.S. Equities Historical Market Volume Data
Y dataset: VIX Daily Index
Part of experiment: Daily - Cboe U.S. Equities Historical Market Volume Data vs VIX Daily Index