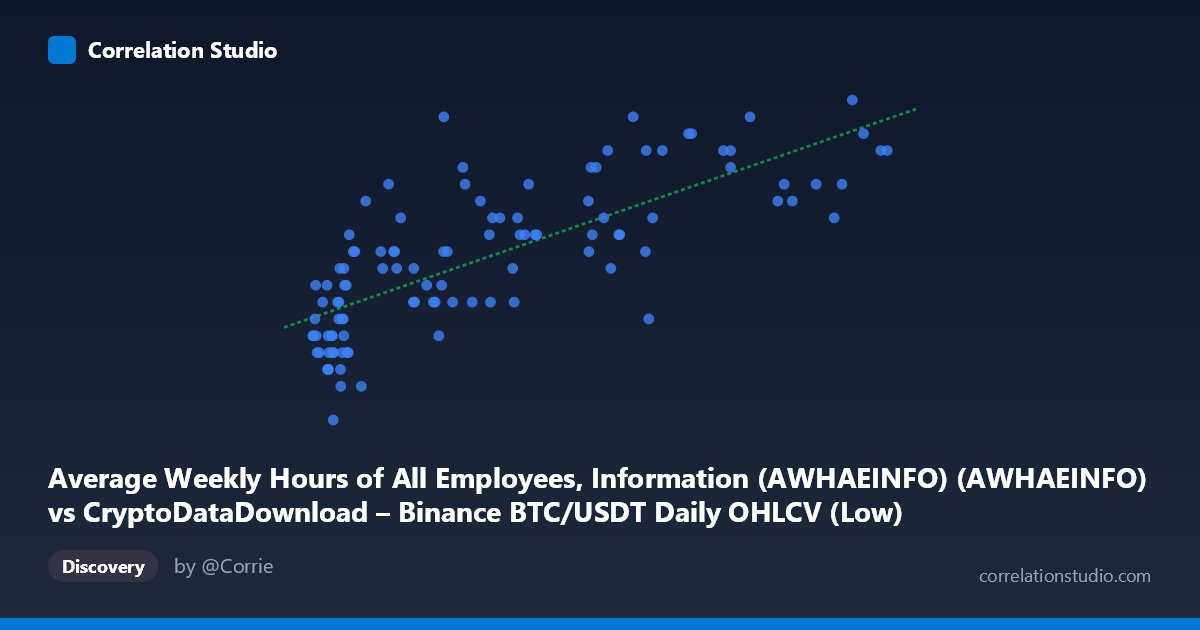
Average Weekly Hours of All Employees, Information (AWHAEINFO) (AWHAEINFO) vs CryptoDataDownload – Binance BTC/USDT Daily OHLCV (Low)
- Pearson correlation (r)
- 0.7621
- Spearman correlation
- 0.8023
- p-value
- 0
- Sample size (n)
- 106
- 95% confidence interval
- 0.6685 to 0.8319
- Granger causality
- None
- Granger optimal lag
- 1
AI analysis
Analysis: BTC/USDT Price vs. Average Weekly Hours (Information Sector)
1. What the Visualization Reveals
The scatterplot shows a positive, moderately strong relationship between BTC/USDT trading levels (X-axis) and average weekly hours worked in the Information sector (Y-axis). As Bitcoin values rise from the ~$3,400–$10,000 range into the $60,000–$113,000 range, average weekly hours climb from roughly 35.7–36.2 hours toward 37.0–38.0 hours. The data forms a loose upward-sloping band rather than a tight line, with visible scatter around the trend, particularly in the mid-range ($20,000–$60,000).
2. Strength, Direction, and Statistical Confidence
The correlation coefficient (r = 0.753) indicates a moderately strong positive relationship, with r² = 0.566 meaning only about 57% of the variance in weekly hours is statistically associated with BTC price movements — leaving 43% unexplained by this single variable. The 95% confidence interval [0.656, 0.825] is reasonably tight and excludes zero, and the p-value of ~0 confirms this correlation is highly unlikely to be due to random chance in this sample. However, Granger causality tests show no significant predictive direction in either direction (X→Y: p=0.498; Y→X: p=0.794). This is a critical caveat: despite the strong contemporaneous correlation, neither variable helps forecast the other's future values based on past data. This strongly suggests the relationship is not causal but likely driven by a shared underlying trend (e.g., both series trending upward over the 2017–2026 period, possibly tied to broader macroeconomic recovery/growth cycles).
3. Notable Patterns and Structure
The relationship appears piecewise or logarithmic rather than strictly linear — hours increase relatively steeply as BTC moves from low thousands to tens of thousands, then the rate of increase moderates at higher BTC values (60k–113k), where hours plateau in the 36.8–38.0 range. There's a dense cluster of low-BTC-price points (X < $10,000) with hours mostly between 35.7–36.6, suggesting this represents an early, low-volatility period. A few notable outliers include the (68,062.86, 36.30) point sitting below the trend line amid otherwise higher-hours neighbors at similar price levels, and (28,624.57, 37.50), which sits above trend for its price range — indicating some structural variability not captured by price alone.
4. Confounding Factors and Caveats
This pairing is a classic case of spurious correlation risk: BTC price and labor statistics have no plausible direct causal mechanism connecting them. Both series likely share a common confound — time itself. Both datasets span 2017–2026, a period of general economic growth, inflation, and post-pandemic recovery, during which both crypto valuations and sector-wage/hour metrics trended upward independently. This is reinforced by the lack of Granger causality — the correlation is likely an artifact of two non-stationary trending series correlated in calendar time rather than a genuine economic relationship. Additionally, monthly-frequency labor data paired with daily crypto OHLCV data creates a temporal resolution mismatch, and sample size (n=105) is a fraction of the full population (N=243), potentially introducing selection bias.
5. Recommendations for Further Investigation
Given the Granger causality results, this correlation should not be used for predictive or trading purposes. To validate whether this is spurious, analysts should: (a) detrend both series (e.g., first-difference or percentage-change transformations) and re-test correlation to see if it disappears; (b) run a cointegration test (e.g., Engle-Granger) to check for a genuine long-run equilibrium relationship; (c) introduce control variables such as overall market indices, inflation rates, or tech-sector employment trends that may better explain both variables' upward trajectories. Absent stronger causal evidence, this relationship is best framed as a coincidental co-trending pattern rather than an economically meaningful signal.
X dataset: CryptoDataDownload – Binance BTC/USDT Daily OHLCV
Y dataset: Average Weekly Hours of All Employees, Information (AWHAEINFO)
Part of experiment: Bitcoin - CryptoDataDownload – Binance BTC/USDT Daily OHLCV vs Average Weekly Hours of All Employees, Information (AWHAEINFO)