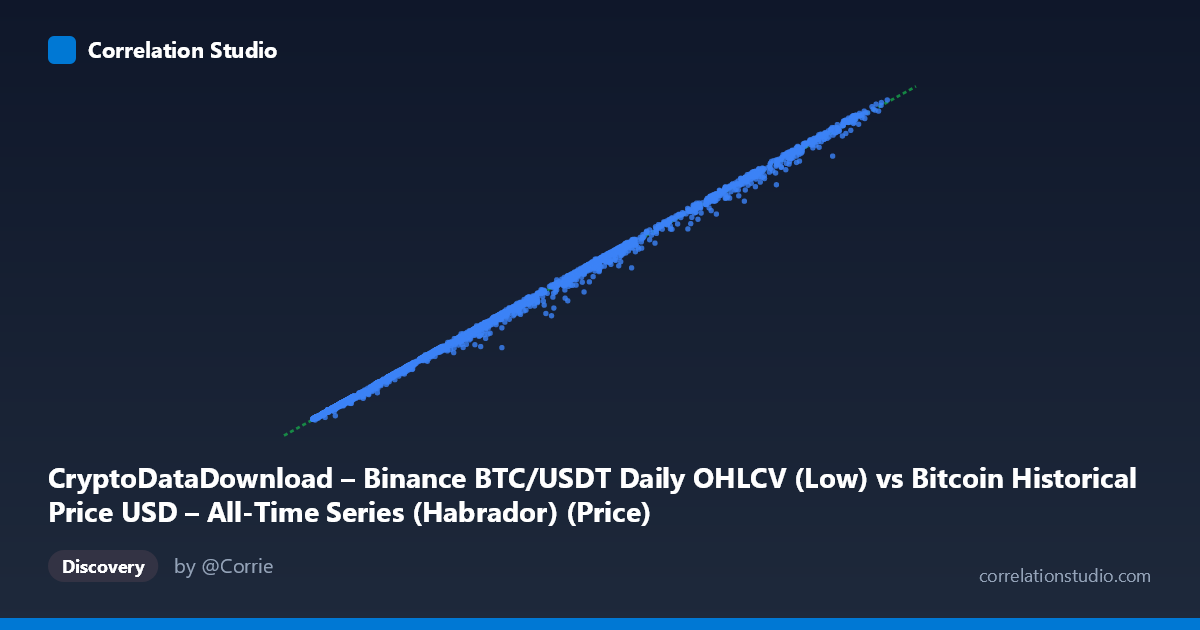
CryptoDataDownload – Binance BTC/USDT Daily OHLCV (Low) vs Bitcoin Historical Price USD – All-Time Series (Habrador) (Price)
- Pearson correlation (r)
- 0.9995
- Spearman correlation
- 0.9994
- p-value
- 0
- Sample size (n)
- 3169
- 95% confidence interval
- 0.9994 to 0.9995
- Granger causality
- Bidirectional
- Granger optimal lag
- 10
AI analysis
Analysis: BTC/USDT Daily Low vs. Binance Price Series
1. What the Visualization Reveals
The scatterplot shows an almost perfectly linear relationship between the two price series, with points tightly hugging a diagonal line across nearly two orders of magnitude (from ~$3,200 to ~$124,700). This is expected given the underlying data: both series originate from Bitcoin price records covering overlapping time periods (2017–2026), and one is effectively a near-duplicate or closely derived measure of the other (a "Low" price column vs. a general "Price" column, both referencing Binance BTC/USDT). The tight clustering along the regression line at all price magnitudes — from four-figure to six-figure BTC prices — indicates the relationship holds consistently across market regimes (bear markets, bull runs, and consolidation phases alike).
2. Strength, Direction, and Statistical Confidence
The correlation is essentially maximal: r = 0.9995, meaning r² = 0.9989 — 99.89% of the variance in Y is explained by X via the linear fit (y ≈ 0.981x − 188). The 95% CI [0.9994, 0.9995] is extremely narrow, and with p ≈ 0, there is virtually no uncertainty that this relationship is real and non-random (unsurprising given n = 3,169). Practically, this means the two series are near-interchangeable proxies for the same underlying price trajectory. The Granger causality results — bidirectional at lag 10, with nearly identical F-statistics (2.4895 vs. 2.4898) and p = 0.0057 for both directions — are the most interesting finding: neither series meaningfully "leads" the other. This symmetric, weak-but-significant bidirectional signal is consistent with the two series being contemporaneous measurements of the same asset rather than one causally driving the other in a temporal/predictive sense.
3. Notable Patterns and Features
The slope (0.981) and near-zero intercept (−188) confirm a nearly 1:1 relationship with a slight systematic offset — Y tends to run marginally lower than X at higher price levels (e.g., at X=124,720, expected Y ≈ 122,225, close to actual observed Y range ceiling of 123,084). No obvious heteroscedasticity, curvature, or regime breaks are apparent from the sample points; deviations appear proportional to price level (e.g., $57,284.92→$53,879 and $46,627.78→$44,300 show larger absolute gaps than smaller-price pairs), suggestive of mild multiplicative/percentage-based noise rather than additive noise — common when comparing "Low" vs. "Close/settlement" style price fields during volatile trading days.
4. Confounding Factors and Caveats
The central caveat is that this is not two independent phenomena — both series describe Bitcoin's price, with one being a "Low" (intraday minimum) and the other a general "Price" reading, likely Close or an aggregated value, from the same or a related exchange feed. Correlation this close to 1 typically arises from measurement redundancy, not from a substantive economic relationship. The Granger causality result, while statistically significant, should be interpreted cautiously: with high-frequency financial series, spurious bidirectional "causality" can emerge from shared volatility clustering, autocorrelation, or non-stationarity (BTC prices are highly non-stationary/trending), rather than true information transfer. The dataset also spans multiple bubble cycles (2017, 2021, 2024–25), so the linear fit is dominated by the extreme price range compression at scale — log-transforming prices would likely be more appropriate for volatility/return analysis.
5. Actionable Insights
Given the near-duplicate nature of these series, further analysis should pivot away from raw price-level correlation (which is trivially confirmatory) toward return-based or log-difference correlation to assess genuine lead-lag dynamics, spread/basis behavior between Low and Price fields, or arbitrage-relevant discrepancies. It would be more valuable to examine the residuals (Y − ŷ) over time to detect systematic periods where the Low price diverges from the reference Price — such divergences could flag data quality issues, exchange-specific liquidity gaps, or flash-crash events. The Granger causality test should be rerun on stationary (differenced/returns) data, as the current result on price levels is likely an artifact of shared trend rather than genuine predictive value.
X dataset: Bitcoin Historical Price USD – All-Time Series (Habrador)
Y dataset: CryptoDataDownload – Binance BTC/USDT Daily OHLCV
Part of experiment: Bitcoin - Bitcoin Historical Price USD – All-Time Series (Habrador) vs CryptoDataDownload – Binance BTC/USDT Daily OHLCV