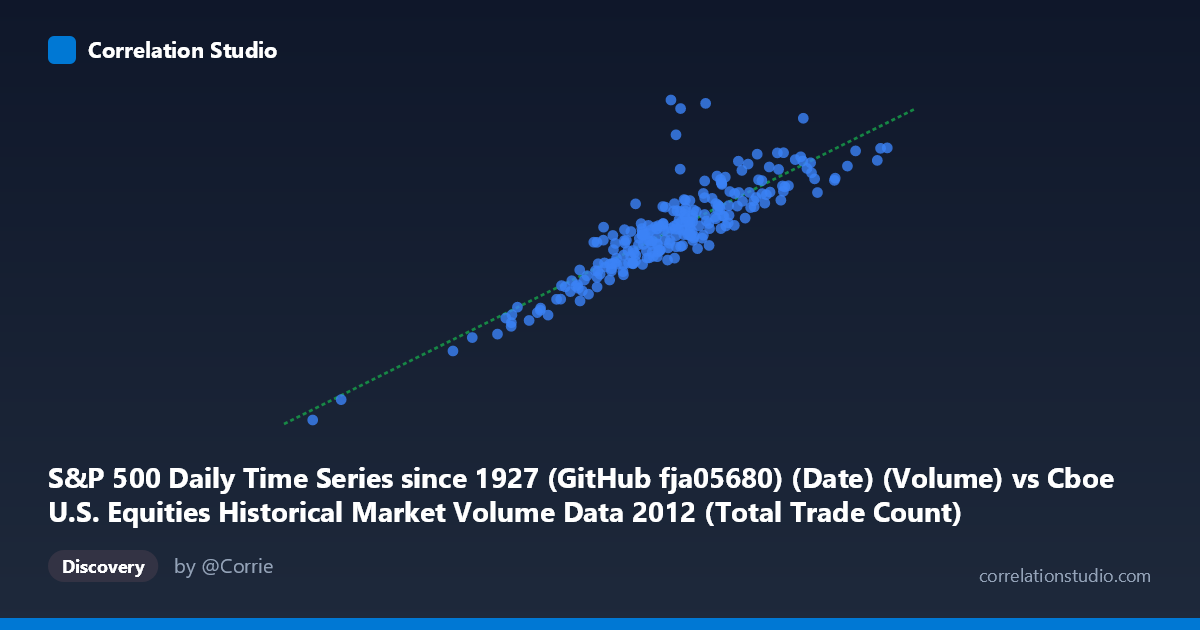
S&P 500 Daily Time Series since 1927 (GitHub fja05680) (Date) (Volume) vs Cboe U.S. Equities Historical Market Volume Data 2012 (Total Trade Count)
- Pearson correlation (r)
- 0.8803
- Spearman correlation
- 0.8824
- p-value
- 0
- Sample size (n)
- 250
- 95% confidence interval
- 0.849 to 0.9055
- Granger causality
- None
- Granger optimal lag
- 10
AI analysis
Analysis: S&P 500 Trading Volume vs. Total Trade Count (2012)
Relationship Overview The scatterplot reveals a strong positive linear relationship between S&P 500 daily trading volume (X) and total trade count across U.S. equities exchanges (Y) for the 2012 trading year. As daily share volume increases, the total number of trades rises correspondingly, which is intuitively sensible — higher market activity days tend to generate both more shares changing hands and more discrete transaction events. The linear regression equation (y = 2124.16x + 1.338×10⁸) suggests that for every additional unit of volume, trade count increases by approximately 2,124 trades, with a substantial baseline intercept reflecting a floor of market activity regardless of volume levels.
Correlation Strength and Statistical Significance The correlation is strong and statistically robust (r = 0.8803), with r² = 0.7750 indicating that 77.5% of the variance in total trade count is explained by trading volume alone — a substantial explanatory share for financial market data. The 95% confidence interval [0.8490, 0.9055] is notably tight, reflecting the large sample size (N = 3,750; n = 250), and the p-value of effectively zero confirms this relationship is not attributable to chance. However, the remaining 22.5% of unexplained variance is meaningful in practice and signals that other factors — market microstructure, algorithmic trading patterns, or exchange-specific dynamics — independently influence trade count. Critically, Granger causality tests find no significant predictive directionality in either direction (X→Y: F = 1.55, p = 0.12; Y→X: F = 1.25, p = 0.26) at the optimal 10-period lag. This means that while the two variables move together contemporaneously, knowing past values of volume does not statistically improve forecasts of future trade count, and vice versa — suggesting the relationship is synchronous co-movement rather than temporal causation.
Notable Patterns, Clusters, and Outliers The data broadly clusters between approximately 1.4M–2.1M in volume and 3.0B–4.5B in trade count, consistent with typical 2012 market conditions. However, several notable deviations are visible. One point at roughly (1,645,164; 5,271,490,000) stands out dramatically as a high-leverage outlier — the trade count is far above the regression line given its moderate volume, suggesting a day with an unusual number of small-lot trades or fragmented order flow. Another cluster of lower-volume, lower-trade-count days (X < 1,300,000; Y < 2,800,000,000) may represent holiday-shortened sessions or low-volatility periods. The spread of residuals appears to widen slightly at higher volume levels, hinting at mild heteroscedasticity — higher-activity days may be more variable in how volume translates into discrete trades.
Confounding Factors and Interpretive Caveats Several important caveats apply. First, the axis labels appear swapped in their dataset descriptions — the X-axis is labeled as coming from the S&P 500 dataset but represents "Volume," while the Y-axis comes from the Cboe dataset but represents "Total Trade Count." This cross-dataset pairing warrants careful validation of the join logic (likely on date). Second, both variables are likely driven by common latent factors such as market volatility (VIX levels), major macroeconomic announcements (FOMC decisions, jobs reports), or risk-on/risk-off sentiment shifts in 2012 (e.g., European debt crisis episodes). The absence of Granger causality strongly supports this confounding interpretation — a third variable is likely driving both simultaneously. Third, algorithmic and high-frequency trading fragmentation in 2012 means that trade count can spike independently of volume as algorithms split large orders into many small executions.
Actionable Insights and Further Investigation Despite the Granger null result, the strong contemporaneous correlation (r² = 0.775) makes trade count a reasonable real-time proxy for volume when one measure is delayed or unavailable, particularly for same-day monitoring. To deepen understanding, analysts should: (1) incorporate VIX or realized volatility as a control variable to test whether the correlation persists after accounting for volatility-driven co-movement; (2) investigate the outlier day (~5.27B trade count) by identifying the calendar date and any associated market events; (3) perform exchange-level decomposition of the Cboe trade count to determine whether specific venues disproportionately drive the unexplained variance; and (4) extend the analysis across multiple years to test whether the 2012 relationship is structurally stable or specific to that period's regulatory and market-microstructure environment.
X dataset: Cboe U.S. Equities Historical Market Volume Data 2012
Y dataset: S&P 500 Daily Time Series since 1927 (GitHub fja05680) (Date)
Part of experiment: Daily - Cboe U.S. Equities Historical Market Volume Data 2012 vs S&P 500 Daily Time Series since 1927 (GitHub fja05680) (Date)