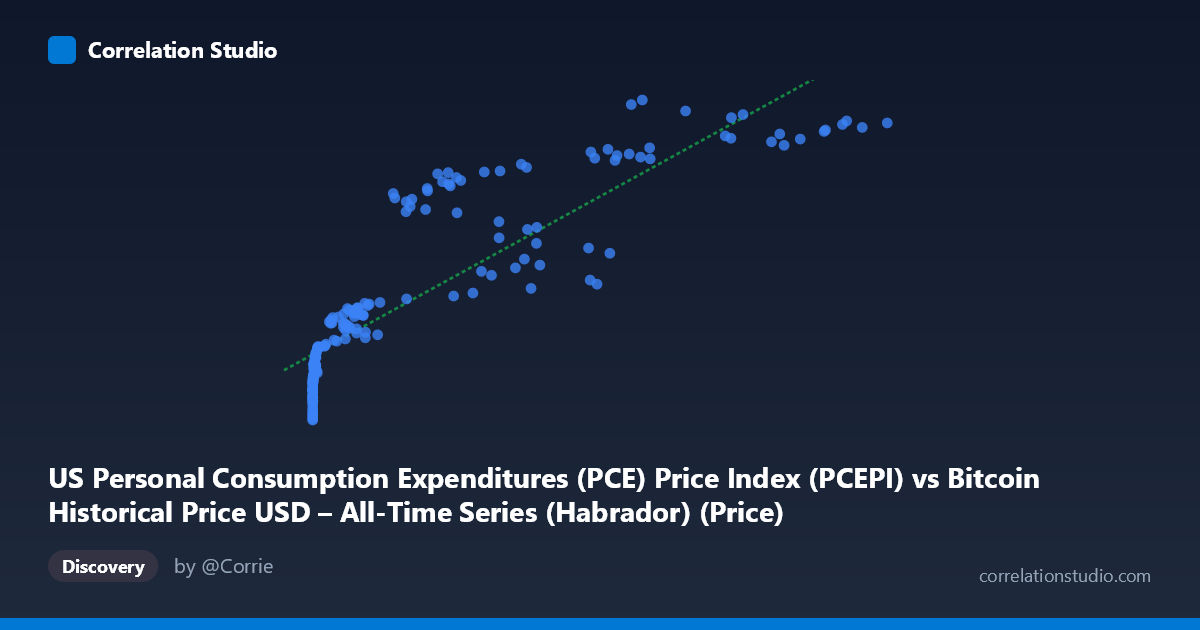
US Personal Consumption Expenditures (PCE) Price Index (PCEPI) vs Bitcoin Historical Price USD – All-Time Series (Habrador) (Price)
- Pearson correlation (r)
- 0.8778
- Spearman correlation
- 0.9734
- p-value
- 0
- Sample size (n)
- 189
- 95% confidence interval
- 0.8403 to 0.9069
- Granger causality
- None
- Granger optimal lag
- 1
AI analysis
Analysis: Bitcoin Price vs. US PCE Price Index
1. What the Visualization Reveals
The scatterplot shows a strong positive, distinctly non-linear (logarithmic-style) relationship between Bitcoin's USD price and the PCE Price Index. Y (PCE) rises steeply at low X values, then flattens into a much shallower slope as Bitcoin's price grows into the tens of thousands. This is the classic signature of two series that are each trending upward over time (Bitcoin price and US inflation index both secularly increase from 2010–2026) rather than a direct mechanical relationship between the variables themselves. The clustering at low X (hundreds of points below $1,000 with PCE ~90–100) versus the sparse but rising tail beyond $50,000 (PCE ~110–131) illustrates that most of the "curve shape" is being driven by Bitcoin's multi-order-of-magnitude price range compressed against a relatively narrow, steadily climbing inflation index.
2. Strength, Direction, and Uncertainty
The Pearson correlation (r = 0.878) is strong, and r² = 0.770 indicates roughly 77% of the variance in the PCE Index can be statistically associated with Bitcoin price levels — a high figure, but this must be interpreted cautiously given the non-linear pattern noted above. The 95% CI [0.840, 0.907] is tight and excludes zero, and the p-value is effectively 0, confirming the correlation is statistically robust and not a sampling artifact. However, Granger causality testing shows neither variable significantly predicts the other (X→Y: p=0.60; Y→X: p=0.12). This is the most important caveat: despite the strong contemporaneous correlation, there is no evidence of a temporal, predictive leading relationship in either direction. This strongly supports the interpretation that both series are independently trending upward over the same 16-year window (common trend/time confound) rather than one causally driving the other.
3. Notable Patterns and Outliers
- Dense low-X cluster: The vast majority of data points sit below X=10,000, with PCE values compressed between 90–105 — this is the early-to-mid Bitcoin era where price moved from cents to thousands of dollars while inflation crept up slowly. - Sparse high-X tail: Points above $50,000 (recent bull-market observations) show PCE plateauing around 107–131, with some scatter (e.g., $68,074→130.90 vs. $86,473→128.58) suggesting the relationship weakens/saturates at high Bitcoin prices — diminishing returns in the log-like curve. - Near-zero X values (e.g., X=0.06–20 with Y=90.6–96) represent Bitcoin's earliest history (2010–2011) and anchor the low end of the curve. - No dramatic reversals or negative excursions — the relationship is monotonic but clearly concave (log-shaped), which is why linear R² (0.7704) matches the reported r² closely but likely understates fit quality achievable with a log-transform of X.
4. Confounding Factors and Caveats
The overwhelming confound here is time — both Bitcoin price and the PCE Index are non-stationary series that trend upward over the 2010–2026 span for largely unrelated structural reasons (Bitcoin: adoption/speculation cycles; PCE: monetary policy and macroeconomic inflation dynamics). A correlation between any two upward-trending time series over a long period is common and often spurious in a causal sense — this is a textbook case where "correlation via shared time trend" should be suspected. Additionally, Bitcoin's price is extremely volatile and heavy-tailed (spanning from $0.06 to $118,670), while PCE is comparatively smooth and slow-moving — comparing a volatile asset price to a stable macro index in level form (rather than growth rates) will nearly always produce high nominal correlation absent any economic mechanism.
5. Actionable Insights and Further Investigation
- De-trend both series (e.g., convert to year-over-year % change or first differences) and re-run the correlation; this is the standard remedy for spurious correlation between trending series and would give a more honest measure of co-movement. - Log-transform X given the visibly log-linear shape — this would likely improve model fit and better reflect the true functional form (Bitcoin price growth is naturally multiplicative/exponential). - Given the null Granger causality result, avoid using this relationship for predictive/trading purposes — there's no statistical evidence PCE inflation leads or lags Bitcoin price in this dataset. - Consider testing against other macro variables more theoretically linked to Bitcoin (e.g., real interest rates, M2 money supply, dollar index) which may offer more economically meaningful and causally defensible relationships than a generic price-level index.
X dataset: Bitcoin Historical Price USD – All-Time Series (Habrador)
Y dataset: US Personal Consumption Expenditures (PCE) Price Index
Part of experiment: Bitcoin - Bitcoin Historical Price USD – All-Time Series (Habrador) vs US Personal Consumption Expenditures (PCE) Price Index