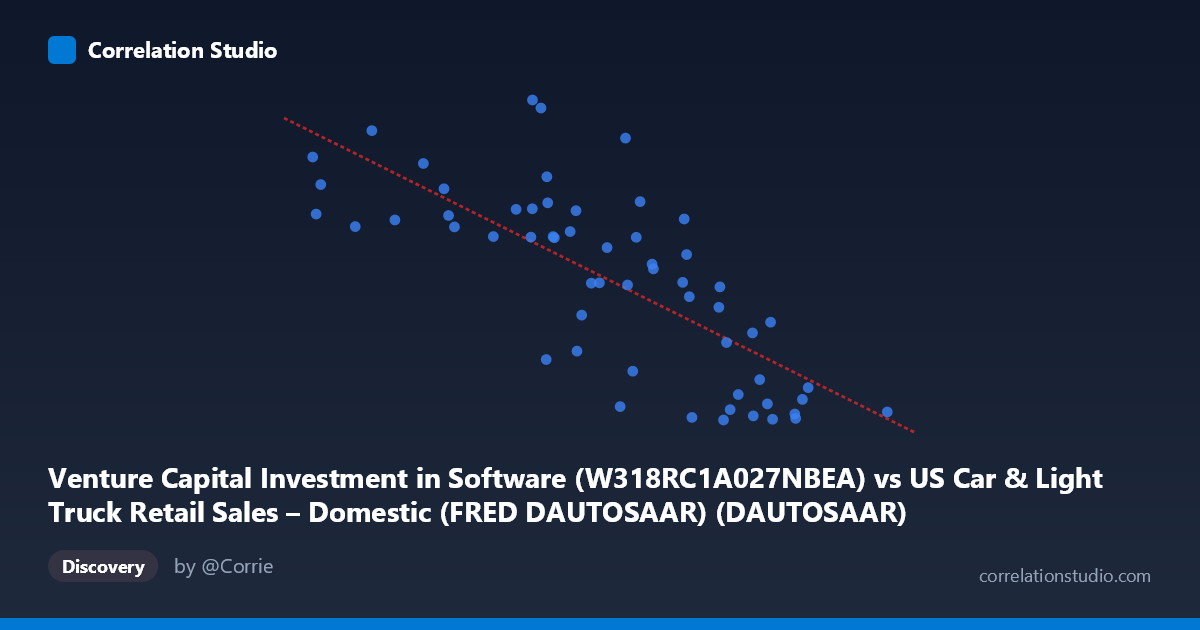
Venture Capital Investment in Software (W318RC1A027NBEA) vs US Car & Light Truck Retail Sales – Domestic (FRED DAUTOSAAR) (DAUTOSAAR)
- Pearson correlation (r)
- -0.7487
- Spearman correlation
- -0.7981
- p-value
- 0
- Sample size (n)
- 58
- 95% confidence interval
- -0.8438 to -0.608
- Granger causality
- None
- Granger optimal lag
- 10
AI analysis
Scatterplot Analysis: Venture Capital Software Investment vs. Domestic Auto Sales
Relationship Overview
The scatterplot reveals a moderate-to-strong negative relationship between Venture Capital Investment in Software and US Domestic Car & Light Truck Retail Sales. As software VC investment increases, domestic auto retail sales tend to decline — a counterintuitive pairing that immediately signals this is likely a spurious or third-variable-driven correlation rather than a direct causal mechanism. The linear regression equation (y = -50.44x + 524.76) confirms the downward slope, with higher VC investment values (roughly 8–10 on the X-axis) clustering near lower auto sales figures, while lower VC investment values (2–5) associate with higher auto sales readings. The data spans 1967–2024, a period of dramatic structural change in both industries, which is critical context for interpretation.
Correlation Strength, Direction, and Statistical Framing
The Pearson correlation of r = -0.749 indicates a meaningful negative association, and the R² of 0.561 means that roughly 56% of the variance in auto sales is statistically explained by VC software investment — a deceptively large figure for two ostensibly unrelated variables. The 95% confidence interval of [-0.844, -0.608] is entirely negative and relatively narrow, suggesting the direction of association is robust across plausible sampling variation. The p-value of 1.4 × 10⁻¹¹ is highly significant, making it extremely unlikely this correlation arose by random chance in the sample. However — and critically — the Granger causality tests show no significant predictive directionality in either direction (X→Y: F = 0.93, p = 0.53; Y→X: F = 1.43, p = 0.22), even at an optimal lag of 10 periods. This means neither variable reliably predicts the future values of the other, strongly undermining any causal narrative and suggesting the correlation is driven by shared temporal trends rather than a real economic linkage.
Notable Patterns, Clusters, and Outliers
Several features stand out visually. There is a loose upper-left cluster (X: 2–5, Y: 270–466) representing periods of low VC software investment and relatively high auto sales — broadly consistent with pre-digital-boom decades. A lower-right cluster (X: 8–10, Y: 12–70) captures high-VC, low-auto-sales periods, likely post-2000s. The spread at mid-range X values (5–7) is notably wide, with Y values ranging from roughly 30 to 466, suggesting the relationship is far from deterministic in that region and possibly non-linear. Several points deserve attention as outliers: (5.16, 466.42) and (5.27, 455.02) are extreme high-Y values, while (7.84, 11.69), (8.53, 12.74), and (8.85, 13.97) anchor the low-Y extreme. The residual scatter is substantial throughout, consistent with the 44% unexplained variance.
Confounding Factors and Interpretive Caveats
This correlation is a textbook candidate for spurious correlation driven by secular time trends. Both variables have strong temporal signatures: domestic auto sales have been on a long-term structural decline (import competition, demographic shifts, ride-sharing), while VC software investment has grown exponentially since the 1990s. When two time series move in opposite directions over decades, they will mechanically produce high correlations regardless of any real-world connection. Additionally, the dataset mixes monthly auto sales data with annual VC investment data, creating temporal resolution mismatches that complicate paired-sample inference. The population size (N = 79) versus paired sample (n = 58) discrepancy also warrants scrutiny regarding how missing pairs were handled. The axes labels appear swapped in the metadata — the X-axis label references VC investment while the dataset name references auto sales, and vice versa — suggesting potential metadata confusion that should be verified before drawing conclusions.
Actionable Insights and Further Investigation
Given the absence of Granger causality, this correlation should not be used for forecasting or policy purposes in its current form. The most productive next steps would be to: (1) detrend both time series (e.g., using first differences or percentage changes) to remove secular trend-driven spurious correlation and retest; (2) introduce time as an explicit covariate or use a co-integration framework appropriate for long-run non-stationary series; (3) investigate shared confounders such as GDP growth, which drives both consumer vehicle purchasing and investor risk appetite simultaneously; and (4) resolve the metadata/axis labeling discrepancy to ensure the correct variables are being analyzed. If the correlation persists after detrending, a more theoretically grounded explanation — such as capital reallocation from traditional manufacturing economies toward tech — could be explored, but would require qualitative economic modeling beyond simple bivariate statistics.
X dataset: US Car & Light Truck Retail Sales – Domestic (FRED DAUTOSAAR)
Y dataset: Venture Capital Investment in Software
Part of experiment: Yearly - US Car & Light Truck Retail Sales – Domestic (FRED DAUTOSAAR) vs Venture Capital Investment in Software