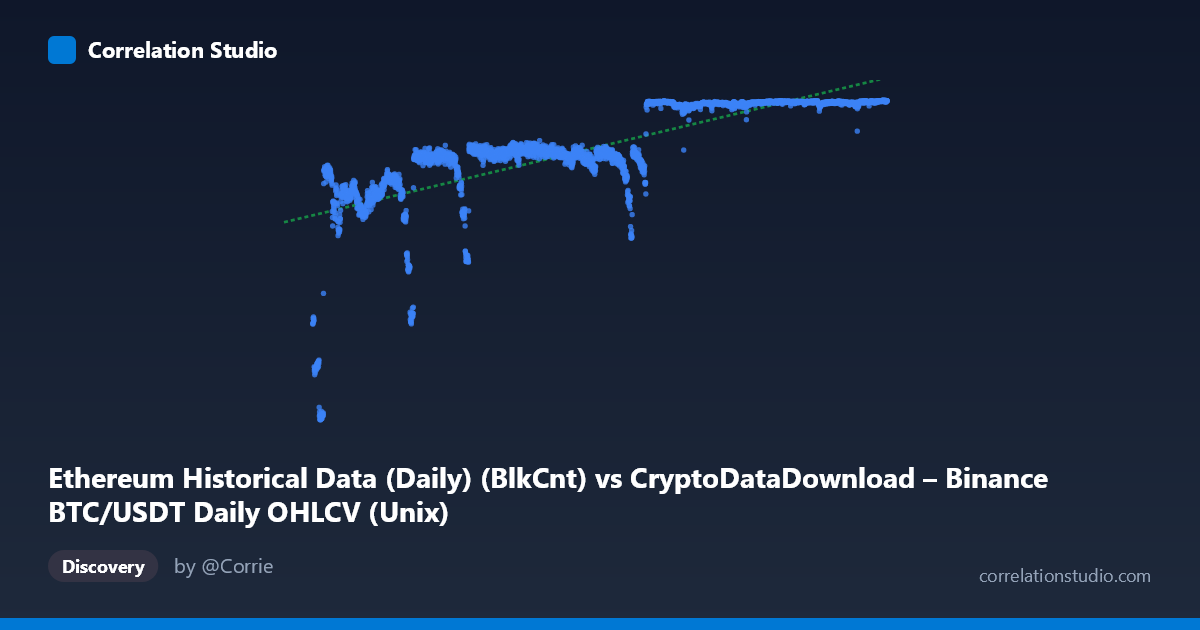
Ethereum Historical Data (Daily) (BlkCnt) vs CryptoDataDownload – Binance BTC/USDT Daily OHLCV (Unix)
- Pearson correlation (r)
- 0.772
- Spearman correlation
- 0.8687
- p-value
- 0
- Sample size (n)
- 3191
- 95% confidence interval
- 0.7576 to 0.7857
- Granger causality
- None
- Granger optimal lag
- 1
AI analysis
Analysis: BTC/USDT Price Timeline vs. Ethereum Timestamp
Important Note on Data Structure Before interpreting correlation, it's critical to flag a likely metadata mislabeling: the X-axis is described as "BlkCnt" (block count) but its values (~1.5–1.78 trillion) and range are clearly Unix millisecond timestamps, not block counts. Similarly, the Y-axis is labeled with a Unix timestamp column name but its values (2829–7190) look like an actual metric (likely Ethereum block count or a similar network statistic). This appears to be a case of swapped/mislabeled column headers. The analysis below treats X as a time index and Y as an evolving metric that trends upward over the 2017–2026 window, which is consistent with the sample data pattern.
1. What the Visualization Reveals The scatterplot shows a metric (Y) that climbs sharply from ~2,800–3,500 in 2017 to a plateau near 7,100–7,180 by 2024–2026. This is not a classic linear cloud of points but rather a time-series growth curve plotted against its own timestamp — early periods show rapid, volatile increases, while later periods (2023 onward) show the metric flattening near its ceiling (~7,150–7,180), suggesting saturation or a structural upper bound.
2. Strength, Direction, and Predictive Relationship The correlation coefficient (r = 0.772, r² = 0.596) indicates a moderately strong positive relationship, with the linear model explaining about 60% of the variance in Y. The tight confidence interval [0.758, 0.786] and p-value of 0 confirm this relationship is highly statistically reliable given the large sample (n=3,191) — there is essentially no doubt a positive association exists. However, r² of 0.596 also means 40% of the variance is unexplained by a linear fit, consistent with the visibly non-linear, logarithmic-like growth-then-plateau shape rather than a straight line. The Granger causality tests show no significant predictive direction in either direction (X→Y: p=0.183; Y→X: p=0.993), meaning neither series meaningfully forecasts the other's short-term (1-lag) changes — unsurprising if X is essentially a time index, since "time causing metric" isn't a meaningful Granger relationship in the traditional sense.
3. Notable Patterns and Features - Early rapid growth (2017–2018): Y jumps from ~2,800 to ~6,000 within about a year — the steepest segment. - Mid-period volatility/plateau (2019–2022): Y oscillates in a 6,300–6,550 band with little net growth, suggesting a multi-year consolidation phase. - Late-stage saturation (2023–2026): Y compresses into a narrow 7,100–7,180 range, indicating the metric is approaching a ceiling or the network/metric has matured. - The overall shape resembles a logistic or diminishing-returns curve, not a straight line — explaining why linear r² caps at ~60%.
4. Confounding Factors and Caveats - Label ambiguity: as noted, axis names suggest a data-pipeline error (timestamp vs. metric swap), which should be resolved before drawing domain conclusions (e.g., about actual BTC-ETH network relationships). - Autocorrelation: both series are highly autocorrelated over time (especially if X is literally time), which inflates r and violates independence assumptions underlying the p-value — the "N=3,212 vs n=3,191" gap also suggests missing-data handling that could bias results. - Non-stationarity: growth-and-plateau curves are non-stationary; Pearson r is not ideal for this shape, and Granger causality on non-stationary series can produce misleading null results unless differenced.
5. Suggested Next Steps - Verify and correct axis/column labels at the source before publishing conclusions. - Fit a non-linear model (logistic, log, or piecewise) instead of linear regression to better capture the growth-plateau dynamic — likely raising explained variance well above 60%. - Difference or detrend both series and re-run Granger causality to test for genuine lead-lag dynamics rather than shared trend. - If X and Y are indeed two different real metrics (not time vs. metric), re-examine using proper time-aligned merge keys and segment the analysis by market regime (bull/bear cycles) to see if the relationship strength varies across periods.
X dataset: CryptoDataDownload – Binance BTC/USDT Daily OHLCV
Y dataset: Ethereum Historical Data (Daily)
Part of experiment: Bitcoin - CryptoDataDownload – Binance BTC/USDT Daily OHLCV vs Ethereum Historical Data (Daily)