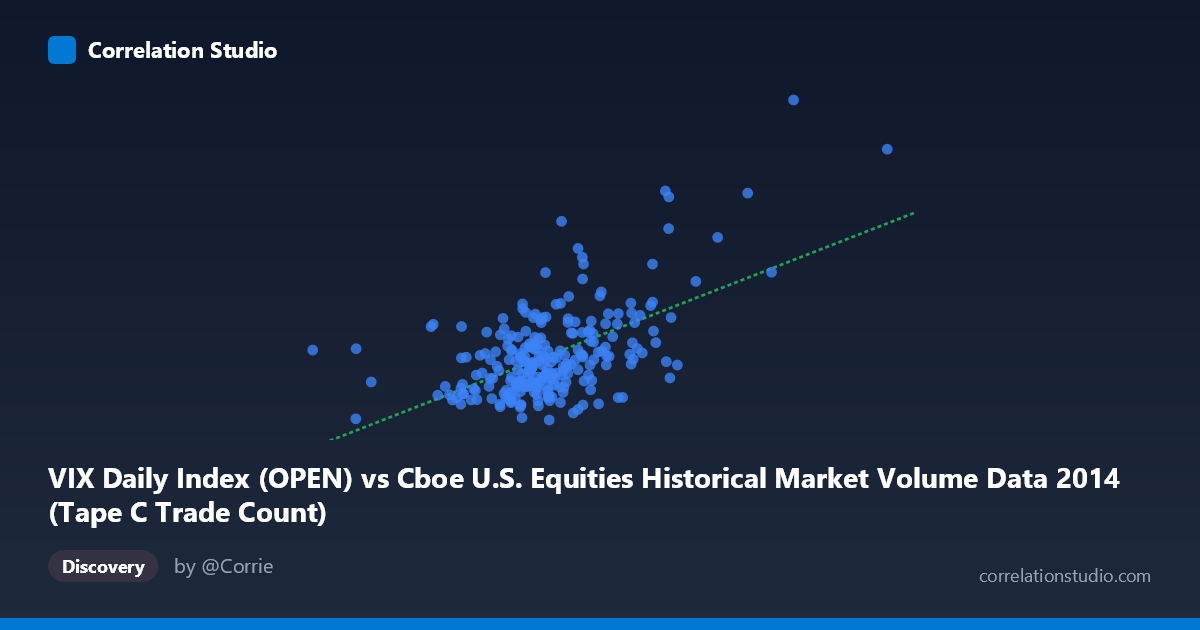
VIX Daily Index (OPEN) vs Cboe U.S. Equities Historical Market Volume Data 2014 (Tape C Trade Count)
- Pearson correlation (r)
- 0.5692
- Spearman correlation
- 0.4191
- p-value
- 0
- Sample size (n)
- 252
- 95% confidence interval
- 0.4794 to 0.6473
- Granger causality
- None
- Granger optimal lag
- 1
AI analysis
Scatterplot Analysis: VIX Open vs. Tape C Trade Count (2014)
Overall Relationship The scatterplot reveals a moderate positive relationship between the CBOE Volatility Index (VIX) daily open values and Tape C trade counts across U.S. equity exchanges in 2014. As VIX levels rise, trade counts on Tape C (NYSE Arca-listed securities) tend to increase, which is broadly intuitive: elevated market volatility typically drives higher trading activity as investors rebalance, hedge, or react to uncertainty. The linear regression equation (y = 1.43×10⁻⁵x + 4.93) confirms this upward slope, though the scatter around the regression line is substantial, indicating that VIX alone is far from a complete explanation of trade volume dynamics.
Correlation Strength and Statistical Significance The Pearson correlation of r = 0.5692 reflects a moderate positive association. More importantly, the R² of 0.3240 means that VIX open values explain only about 32.4% of the variance in Tape C trade counts — leaving roughly two-thirds of the variation attributable to other factors. The 95% confidence interval of [0.4794, 0.6473] is reasonably tight and does not cross zero, and the p-value of effectively 0 confirms this relationship is highly statistically significant given the large population (N = 3,686). However, statistical significance here is partly a function of sample size and should not be conflated with practical or causal significance. Critically, the Granger causality tests show no significant predictive directionality in either direction (X→Y: F = 1.64, p = 0.20; Y→X: F = 0.01, p = 0.91), meaning that past VIX values do not reliably predict future trade counts, nor vice versa, at a one-period lag. This absence of Granger causality tempers any causal narrative despite the meaningful contemporaneous correlation.
Notable Patterns, Clusters, and Outliers The sample points reveal a dense central cluster concentrated in the VIX range of roughly 550,000–750,000 (X-axis units) and trade counts between 10 and 17, suggesting that the majority of 2014 trading days were characterized by relatively subdued volatility and moderate activity. However, there are clear high-leverage outliers — most notably the point near (1,041,591, 29.26), which represents an extreme VIX spike paired with an exceptionally high trade count, and the cluster around (841,278, 23.55), both of which likely correspond to specific stress events in 2014 (such as the October 2014 market correction). These outliers exert disproportionate influence on the regression slope and the correlation coefficient, and the relationship may look considerably weaker if those high-VIX episodes are removed. There is also a hint of non-linearity or heteroscedasticity: variance in trade counts appears to fan out at higher VIX levels, suggesting the relationship may not be purely linear.
Confounding Factors and Caveats Several important caveats apply. First, the unit mismatch in axis labeling (X is described as VIX but ranges into the hundreds of thousands, while VIX typically ranges from 10–80) warrants scrutiny — it is possible the X-axis actually represents market volume or notional value from the Cboe dataset, with the column labels potentially swapped in the visualization. This ambiguity is a fundamental interpretive concern. Second, even if the axes are correctly labeled, seasonal effects (e.g., year-end positioning, summer illiquidity) and macro events (geopolitical shocks, Fed announcements) likely drive both variables simultaneously, creating spurious correlation without direct causation. Third, Tape C trade counts reflect only a subset of total market activity, so the relationship may not generalize to broader volume metrics. Finally, the 2014 sample represents a single, relatively calm year with one notable volatility episode, limiting temporal generalizability.
Actionable Insights and Further Investigation Practitioners should avoid using VIX as a standalone predictor of Tape C trade counts in a trading or operational model, given that only ~32% of variance is explained and Granger causality is absent. Instead, multivariate modeling incorporating additional drivers — such as overall market volume, index returns, bid-ask spreads, and macroeconomic indicators — would likely yield stronger predictive power. It would be valuable to re-examine the data with outlier periods isolated (e.g., running the regression excluding October 2014) to assess whether the correlation is driven primarily by a few stress events. Extending the analysis across multiple years (2015–2020, including COVID-era volatility) would test whether this relationship is structurally stable or period-specific. Finally, resolving the axis labeling ambiguity should be the immediate first step before drawing any operational conclusions from this analysis.
X dataset: Cboe U.S. Equities Historical Market Volume Data 2014
Y dataset: VIX Daily Index
Part of experiment: Daily - Cboe U.S. Equities Historical Market Volume Data 2014 vs VIX Daily Index