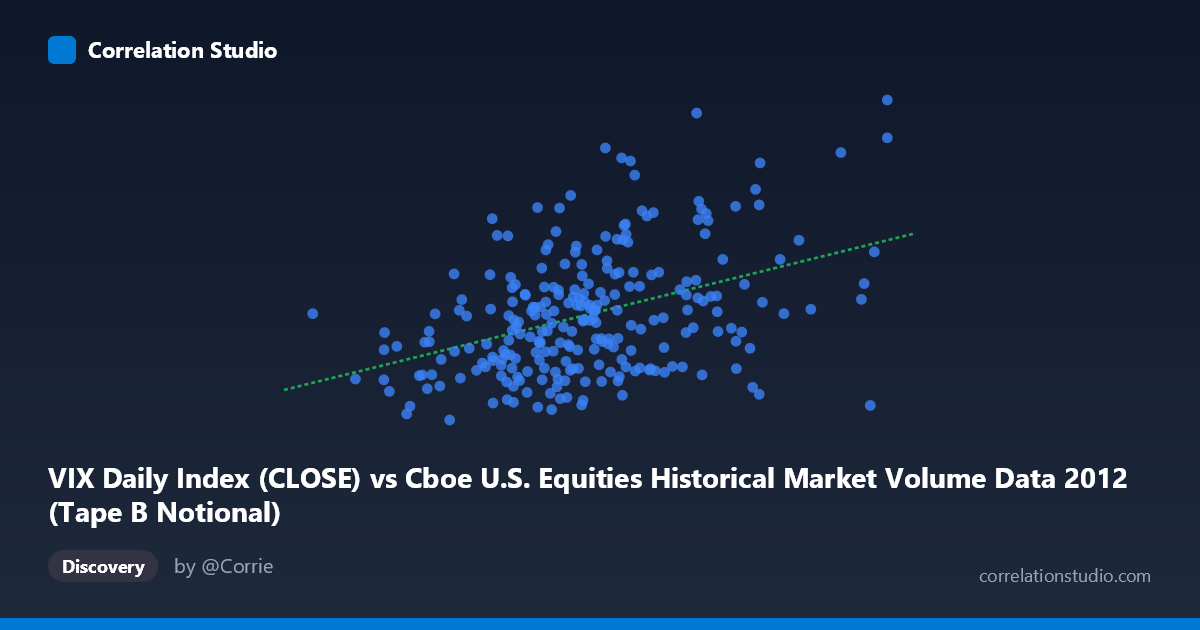
VIX Daily Index (CLOSE) vs Cboe U.S. Equities Historical Market Volume Data 2012 (Tape B Notional)
- Pearson correlation (r)
- 0.4108
- Spearman correlation
- 0.3787
- p-value
- 0
- Sample size (n)
- 250
- 95% confidence interval
- 0.3021 to 0.5089
- Granger causality
- None
- Granger optimal lag
- 1
AI analysis
Scatterplot Analysis: VIX Daily Index vs. Tape B Notional Volume (2012)
Relationship Overview
The scatterplot reveals a moderate positive relationship between the VIX Daily Index (close) and Tape B Notional trading volume across U.S. equity exchanges in 2012. As VIX values rise — indicating higher implied market volatility — Tape B Notional volume tends to increase as well, consistent with the well-established market intuition that volatility spurs trading activity. The linear regression equation (y = 1.27×10⁻⁹x + 13.19) confirms this upward slope, though the relationship is far from deterministic, with considerable vertical scatter throughout the plot suggesting that many days deviate substantially from the fitted line.
Correlation Strength and Statistical Significance
The Pearson correlation of r = 0.41 indicates a moderate positive association, but the explanatory power is modest: r² = 0.169 means that only 16.9% of the variance in Tape B Notional volume is accounted for by VIX levels alone, leaving roughly 83% of variability unexplained by this single predictor. The 95% confidence interval [0.30, 0.51] is reasonably tight and does not cross zero, and the p-value of 1.35×10⁻¹¹ confirms the relationship is highly statistically significant — virtually impossible to attribute to chance given n = 250 and N = 3,750. However, statistical significance here is partly a function of the large sample size rather than an indicator of a strong or practically dominant relationship. Critically, the Granger causality tests find no significant temporal predictive direction in either direction (X→Y: F = 1.94, p = 0.165; Y→X: F = 0.18, p = 0.671), meaning that past VIX values do not reliably predict future Tape B Notional volume and vice versa within the lag structure tested. This tempers any causal interpretation considerably.
Notable Patterns, Clusters, and Outliers
Several features stand out in the scatterplot. The bulk of observations cluster in the VIX range of roughly 2.0–4.5 billion (x-axis) and Notional values of 13–22, forming a dense central cloud. However, there is a visible upper-right cluster of high-VIX, high-Notional days — points with VIX readings above ~22 and Notional values approaching 24–27 — that are likely driving much of the positive correlation signal. A handful of apparent outliers exist at lower VIX values (near 1.4–2.0 billion) with relatively low Notional readings, and at higher VIX extremes with disproportionately elevated Notional values. The spread of Notional volume widens noticeably at higher VIX levels, suggesting possible heteroscedasticity — volatility in volume is itself higher when VIX is elevated — which could violate ordinary least squares assumptions and slightly inflate apparent r.
Confounding Factors and Caveats
Several important caveats apply. First, the axis labeling appears inverted: the dataset descriptions indicate VIX is on the x-axis from the "Market Volume" dataset and Tape B Notional is on the y-axis from the "VIX" dataset — a metadata mismatch that warrants verification before drawing firm conclusions. Second, 2012 was a relatively low-volatility year following the European sovereign debt crisis, meaning the VIX range sampled here may not generalize to other regimes. Third, Tape B Notional is one segment of U.S. equity volume (NYSE American/regional securities), and broader market or macro factors — Federal Reserve communications, earnings seasons, end-of-quarter rebalancing — simultaneously drive both VIX and volume, making confounding by shared macroeconomic drivers a primary concern. The absence of Granger causality also implies neither variable usefully leads the other in a short-lag framework, consistent with both being joint responses to external shocks rather than one causing the other.
Actionable Insights and Further Investigation
Practitioners should treat VIX as a weak concurrent signal for Tape B Notional volume rather than a predictive one, given the lack of Granger causality and the limited r² of 16.9%. For trading desks or market structure analysts, incorporating additional predictors — overall market capitalization, macroeconomic event calendars, or broader tape volume — into a multivariate model would likely substantially improve explanatory power. It would be valuable to test nonlinear specifications (e.g., log-transforming both variables, given their multiplicative nature) to check whether the relationship strengthens or becomes more homoscedastic. Segmenting the data by quarter or volatility regime (e.g., VIX above/below 20) could reveal whether the correlation is driven primarily by a handful of high-stress market days. Finally, resolving the apparent dataset label mismatch and verifying the directionality of the axes should be an immediate priority before any operational decisions are informed by this analysis.
X dataset: Cboe U.S. Equities Historical Market Volume Data 2012
Y dataset: VIX Daily Index
Part of experiment: Daily - Cboe U.S. Equities Historical Market Volume Data 2012 vs VIX Daily Index