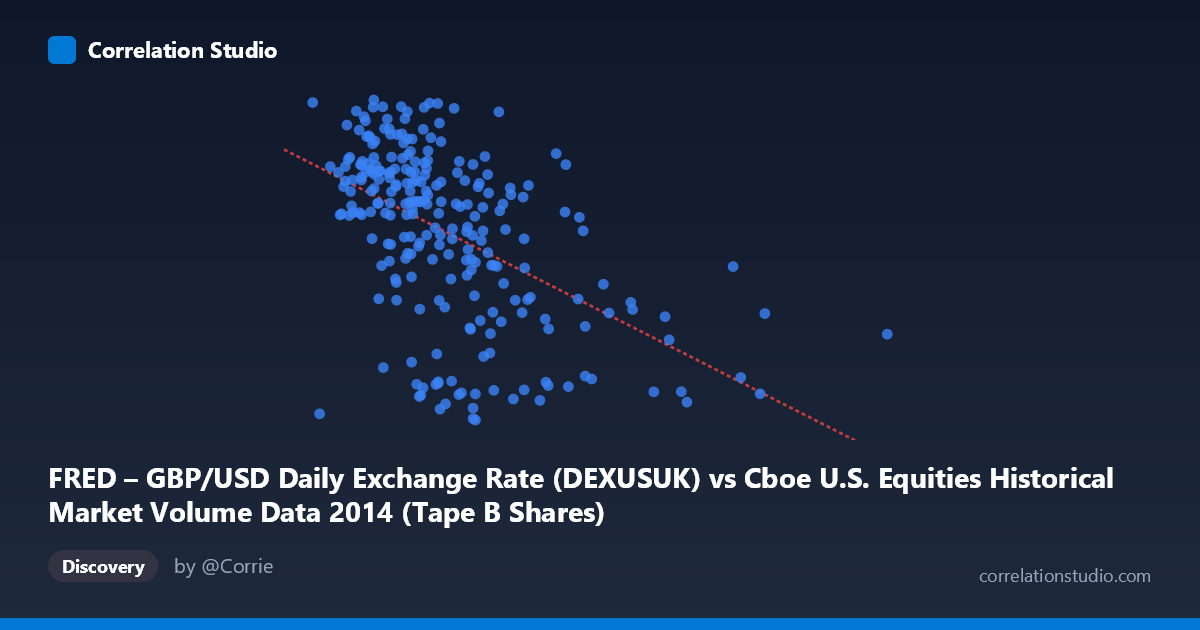
FRED – GBP/USD Daily Exchange Rate (DEXUSUK) vs Cboe U.S. Equities Historical Market Volume Data 2014 (Tape B Shares)
- Pearson correlation (r)
- -0.5127
- Spearman correlation
- -0.5431
- p-value
- 0
- Sample size (n)
- 249
- 95% confidence interval
- -0.5988 to -0.4148
- Granger causality
- None
- Granger optimal lag
- 1
AI analysis
Scatterplot Analysis: GBP/USD Exchange Rate vs. Cboe Tape B Share Volume (2014)
Relationship Overview The scatterplot reveals a moderate negative relationship between U.S. equity market volume (Tape B shares traded) and the GBP/USD exchange rate across 2014. As daily trading volume increases, the pound tends to trade at a lower value against the dollar. The linear regression equation (y = -9.555×10⁻¹⁰x + 1.720) captures this downward slope, though the scatter around the line is considerable. Visually, the data cloud tilts from the upper-left toward the lower-right, consistent with the negative direction, but with enough dispersion to suggest the relationship is far from deterministic. The X variable spans a wide range — roughly 38 million to 196 million shares — while the Y variable (GBP/USD) is compressed between approximately 1.55 and 1.72, meaning even small vertical shifts carry real-world currency significance.
Correlation Strength and Statistical Framing The Pearson correlation of r = -0.513 indicates a moderate negative association, but r² = 0.263 is the more sobering figure: only 26.3% of the variance in GBP/USD is explained by Tape B volume, leaving nearly three-quarters of the exchange rate's daily movement unaccounted for by this variable alone. The 95% confidence interval of [-0.599, -0.415] is reassuringly narrow given n = 249, and the p-value of effectively zero confirms the relationship is statistically significant and unlikely to be a sampling artifact. However, statistical significance here is aided by a large population (N = 3,686) and should not be conflated with practical or causal significance. Critically, Granger causality tests find no meaningful temporal predictive direction in either direction — neither X→Y (F = 0.034, p = 0.854) nor Y→X (F = 0.005, p = 0.946) reaches significance at the optimal lag of one period. This means that knowing yesterday's volume does not help predict today's exchange rate, and vice versa, strongly undermining any causal narrative.
Patterns, Clusters, and Outliers Several structural features stand out in the data. There is a visible cluster of low-volume days (roughly 45–70 million shares) where GBP/USD spans nearly the full range of 1.55–1.72, suggesting high exchange rate variability even when markets are quiet. At higher volume levels (above ~100 million shares), the GBP/USD values appear compressed toward the lower end of the range (1.55–1.66), which drives the observed negative slope. A small number of high-volume outliers — particularly beyond 150 million shares — pull the regression line and may disproportionately influence r. There also appear to be a few days where GBP/USD touched its annual high near 1.72 at relatively modest volume levels, and similarly, the lowest exchange rate readings (~1.55–1.57) cluster at both moderate and high volumes, suggesting the trough in sterling occurred across varying market activity conditions.
Confounding Factors and Interpretive Caveats The most important caveat is that this correlation almost certainly reflects shared exposure to common macroeconomic drivers rather than any direct mechanism between equity volume and currency valuation. Both variables are influenced by risk sentiment, geopolitical events (e.g., the Scottish independence referendum in September 2014 significantly weakened sterling), U.S. Federal Reserve communications, and global volatility shocks. High-volume days in U.S. equities often coincide with risk-off episodes or macro announcements that simultaneously pressure the pound. The dataset axes also appear swapped in labeling (X is described as GBP/USD but labeled as volume, and vice versa), which warrants careful verification before any downstream use. Additionally, the 2014 timeframe is a single-year snapshot; the correlation may not generalize across different market regimes.
Actionable Insights and Further Investigation Given the lack of Granger causality, practitioners should not attempt to use equity volume as a leading indicator for GBP/USD trading, nor treat the exchange rate as a volume predictor. The moderate r² warrants further decomposition — specifically, a multiple regression incorporating VIX, U.S. macro surprise indices, and GBP-specific event dates (e.g., Bank of England meetings, Brexit precursor sentiment) would likely absorb much of the unexplained variance and clarify whether volume remains a meaningful partial predictor once confounders are controlled. Investigating whether the relationship strengthens on specific event-type days (Fed announcements, U.K. data releases) versus quiet days could reveal a conditional relationship masked in aggregate data. Finally, extending the analysis across multiple years would test whether 2014's Scottish referendum effect created a spurious correlation that would not replicate in other periods.
X dataset: Cboe U.S. Equities Historical Market Volume Data 2014
Y dataset: FRED – GBP/USD Daily Exchange Rate
Part of experiment: Daily - Cboe U.S. Equities Historical Market Volume Data 2014 vs FRED – GBP/USD Daily Exchange Rate