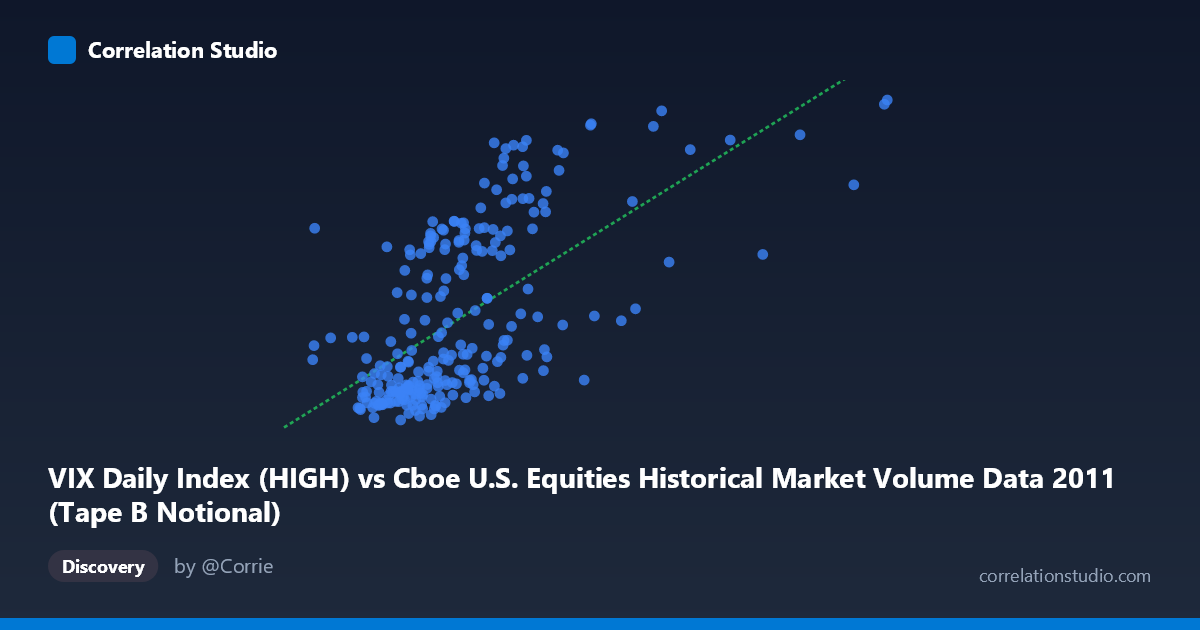
VIX Daily Index (HIGH) vs Cboe U.S. Equities Historical Market Volume Data 2011 (Tape B Notional)
- Pearson correlation (r)
- 0.6272
- Spearman correlation
- 0.6435
- p-value
- 0
- Sample size (n)
- 252
- 95% confidence interval
- 0.5459 to 0.6968
- Granger causality
- None
- Granger optimal lag
- 1
AI analysis
Scatterplot Analysis: VIX Daily Index (HIGH) vs. Tape B Notional Volume (2011)
Relationship Overview
The scatterplot reveals a moderate positive relationship between the VIX Daily Index High values and Tape B Notional trading volume across U.S. equity exchanges in 2011. As VIX readings increase, Tape B Notional volume tends to rise as well, consistent with the well-established financial market intuition that heightened volatility (measured by VIX) drives greater trading activity. The linear regression equation (y = 3.0674E-09x + 9.717) reflects this upward slope, though the data cloud shows considerable scatter around the regression line, indicating the relationship is real but far from deterministic.
Correlation Strength and Statistical Significance
The Pearson correlation of r = 0.627 indicates a moderate-to-strong positive association, but the R² of 0.393 is the more sobering metric: only 39.3% of the variance in Tape B Notional volume is explained by VIX High values, leaving over 60% attributable to other factors. The 95% confidence interval for r [0.546, 0.697] is relatively tight given the sample size of n = 252 (drawn from a population of N = 3,780), and the p-value of essentially zero confirms the correlation is not a statistical artifact. However, the Granger causality results undercut any causal narrative: neither direction (X→Y: F = 0.146, p = 0.703; Y→X: F = 0.004, p = 0.950) shows significant temporal predictive power at a one-period lag. This means that while the two variables move together contemporaneously, neither reliably predicts the other on a lead-lag basis within this dataset.
Notable Patterns, Clusters, and Outliers
The sample points reveal several structurally interesting features. There appears to be a dense cluster at lower VIX values (~3.0–4.5 billion range on X) paired with lower notional volumes (~15–25 on Y), suggesting a baseline regime of calm markets with modest Tape B activity. A second, more dispersed cluster emerges at higher VIX readings (5.5–10+ billion), where notional values span a wider range (~24–48), implying that elevated volatility amplifies volume variability rather than simply lifting it uniformly. Several outliers are notable — points such as (9,956,196,749, 42.88) and (6,102,922,959, 42.99) sit at the upper right, consistent with stress episodes in 2011 (e.g., the U.S. debt ceiling crisis and European sovereign debt contagion in mid-to-late summer). The data also shows heteroscedasticity: variance in Y widens noticeably as X increases, which violates a key assumption of ordinary linear regression and suggests the linear model may underperform at the extremes.
Confounding Factors and Interpretive Caveats
Several important caveats apply. First, the axis assignments appear counterintuitive: VIX is plotted on the X-axis while Tape B Notional (a volume metric from the market volume dataset) is on Y, which reverses the more natural framing where volume would be the dependent variable responding to volatility. This labeling warrants verification. Second, 2011 was an exceptional year marked by discrete macro shocks (S&P U.S. credit downgrade in August, Eurozone crisis escalation), meaning the correlation may be regime-specific and not generalizable to calmer periods. Third, Tape B specifically covers NYSE American (AMEX) and regional exchange securities — a subset of total market volume — so results may not generalize to Tape A or C. Fourth, the absence of Granger causality at lag-1 may simply reflect that the relevant transmission lag is intraday or multi-day, not captured at the daily periodicity used here.
Actionable Insights and Further Investigation
Practitioners should avoid treating this correlation as a reliable real-time trading signal given the failed Granger tests. However, the relationship is strong enough to be useful for risk scenario modeling: when constructing stress tests or liquidity models, higher VIX regimes should incorporate wider bands for Tape B notional activity. For further investigation, it would be valuable to: (1) test non-linear models (e.g., log-log regression or polynomial fits) given the apparent heteroscedasticity; (2) segment analysis by volatility regime (VIX < 20, 20–30, 30) to examine whether the correlation strengthens in high-stress periods; (3) expand Granger testing to multi-day lags (2–5 periods) to capture delayed transmission effects; and (4) include confounding controls such as overall market returns, trading-day calendar effects (e.g., option expiration weeks), and macroeconomic news release schedules to isolate the true VIX-volume relationship.
X dataset: Cboe U.S. Equities Historical Market Volume Data 2011
Y dataset: VIX Daily Index
Part of experiment: Daily - Cboe U.S. Equities Historical Market Volume Data 2011 vs VIX Daily Index