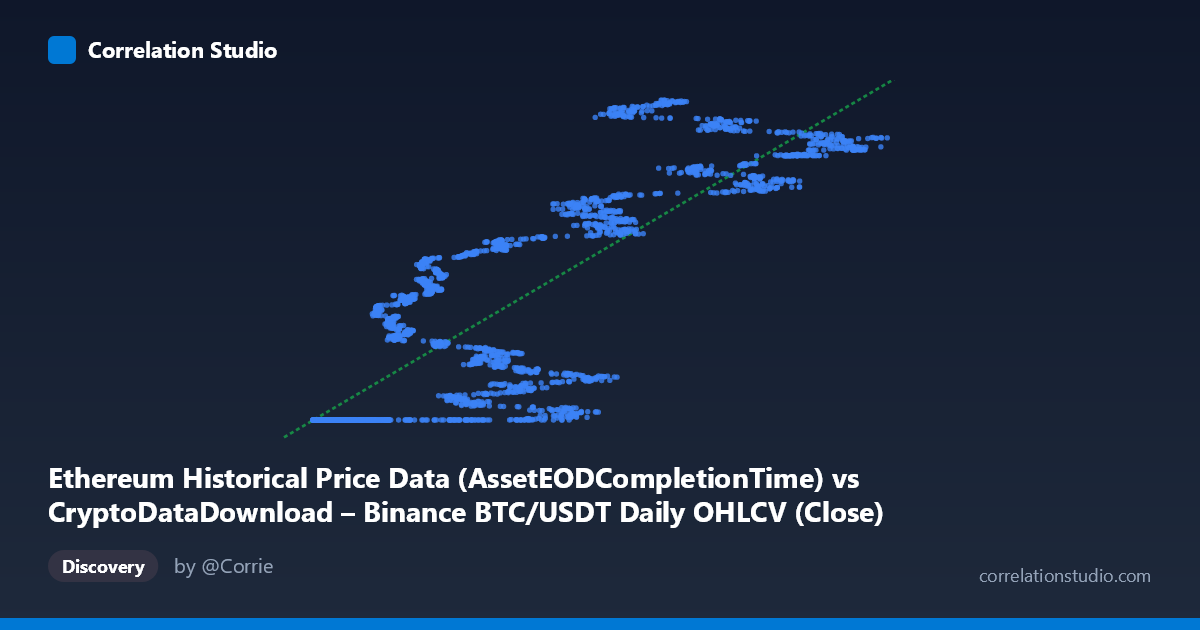
Ethereum Historical Price Data (AssetEODCompletionTime) vs CryptoDataDownload – Binance BTC/USDT Daily OHLCV (Close)
- Pearson correlation (r)
- 0.8523
- Spearman correlation
- 0.8876
- p-value
- 0
- Sample size (n)
- 3191
- 95% confidence interval
- 0.8425 to 0.8615
- Granger causality
- None
- Granger optimal lag
- 10
- Time coverage
- 2017-08-17 to 2026-05-20
AI analysis
Analysis of BTC/USDT vs. Ethereum Price Data Relationship
1. What the Visualization Reveals
The scatterplot shows a positive, moderately strong relationship between the X-axis variable (labeled as Ethereum data but described as BTC/USDT price) and the Y-axis variable (also BTC/USDT close). Despite the confusing column labeling, the data itself shows a clear pattern: at low X values (roughly 3,000–25,000), Y clusters tightly near 1,614,335,000, suggesting a floor or saturation effect. Above X≈25,000, Y increases steadily and more variably, climbing toward 1,780,000,000. This creates a visual "hockey stick" or two-regime shape rather than a single clean linear trend.
2. Strength, Direction, and Statistical Confidence
The correlation coefficient (r = 0.852) indicates a strong positive linear relationship, with r² = 0.727 meaning roughly 73% of the variance in Y is explained by X in a linear model — a substantial but not complete explanatory power, leaving ~27% driven by other factors or nonlinearity. The narrow 95% CI [0.843, 0.862] and p-value of ~0 confirm this correlation is highly statistically reliable, not a product of sampling noise, especially given the large sample size (n=3,191). However, correlation and even statistical significance say nothing about causal direction. The Granger causality tests reinforce this: neither direction (X→Y: p=0.33; Y→X: p=0.17) shows significant predictive power at a 10-period lag. This means that despite the strong contemporaneous correlation, past values of one series do not meaningfully forecast future values of the other — the relationship appears to be driven by shared external factors or simultaneous co-movement rather than one variable leading the other.
3. Notable Patterns and Non-linearities
The most striking feature is the flat "floor" segment where many low-X points (X < 25,000) all map to nearly identical Y values (~1,614,335,200–1,614,335,700) — a suspiciously narrow band given the scale of Y overall. This looks like a data artifact (e.g., a placeholder, minimum-fill, or an early period with low price variance) rather than genuine market dynamics. Above this threshold, the relationship becomes more scattered and heteroscedastic, with increasing variance in Y as X grows — visible in points like (110187.97, 1,757,227,055) vs. (109635.85, 1,759,040,655), which sit close in X but show a wider spread, and outliers like (81447.01, 1,778,121,708) sitting above the general trend line. This suggests the true relationship may be piecewise or logarithmic rather than strictly linear, with the linear model (y = 1431.8x + 1.61E9) fitting the upper regime much better than the lower one.
4. Confounding Factors and Caveats
Both series appear to derive from BTC/USDT price data (per the metadata, despite Y being labeled "Ethereum"), meaning this may not be a cross-asset relationship at all but rather two representations, lags, or transformations of the same underlying price series — a classic case of spurious or tautological correlation. Additionally, both crypto prices (if genuinely BTC and ETH) are known to be driven by common macro factors — overall crypto market sentiment, BTC dominance effects, USD liquidity, and exchange-specific volume dynamics — making it hard to disentangle genuine bivariate dependence from shared confounds. The flat floor segment further suggests possible data quality issues (missing values imputed with a constant, or an early period with anomalously low/stable pricing) that could artificially inflate the linear fit.
5. Actionable Insights and Further Investigation
First, clarify the actual data source/labeling — verify whether Y is truly Ethereum price or mislabeled BTC data, since the metadata conflict undermines interpretation. Second, investigate the flat-floor cluster (X<25,000) separately — check timestamps/dates for these points to determine if they represent a specific historical period (e.g., 2017–2018 early data) with data quality problems. Third, given the lack of Granger causality, avoid using one series to forecast the other in a trading or predictive model; instead, treat both as co-moving with a shared latent driver (e.g., overall crypto market beta) and consider modeling that common factor directly. Finally, a piecewise or log-log regression should be tested against the current linear model, as splitting the data at the apparent regime change (~X=25,000) could meaningfully improve R² and better reflect the true functional form.
X dataset: CryptoDataDownload – Binance BTC/USDT Daily OHLCV
Y dataset: Ethereum Historical Price Data
Part of experiment: Bitcoin - CryptoDataDownload – Binance BTC/USDT Daily OHLCV vs Ethereum Historical Price Data