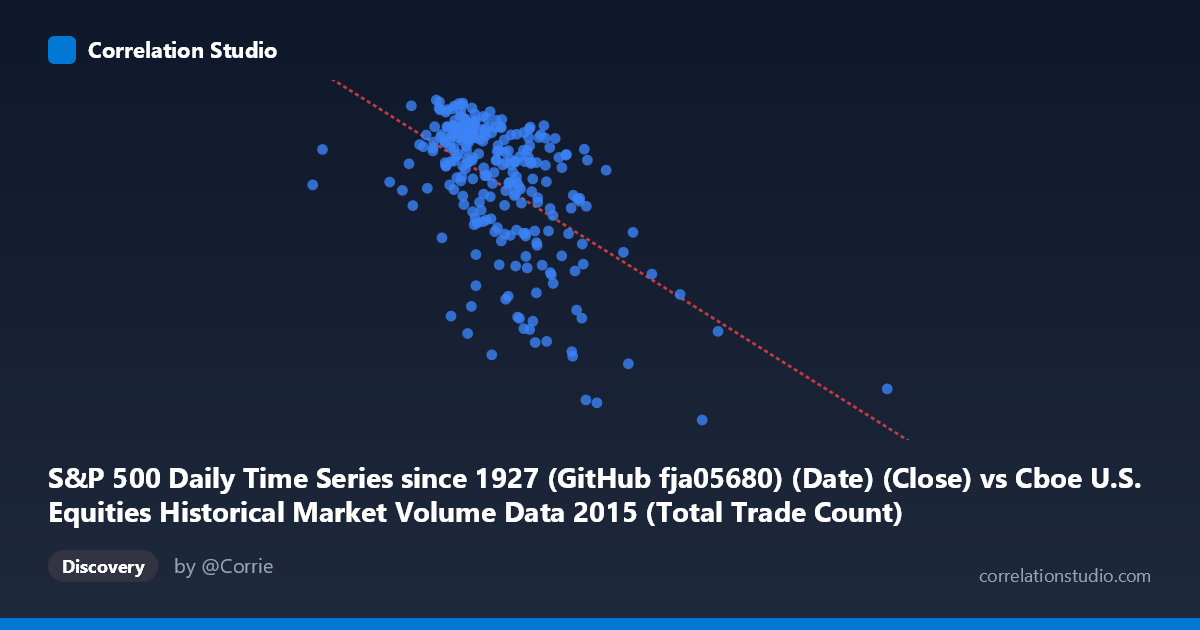
S&P 500 Daily Time Series since 1927 (GitHub fja05680) (Date) (Close) vs Cboe U.S. Equities Historical Market Volume Data 2015 (Total Trade Count)
- Pearson correlation (r)
- -0.5523
- Spearman correlation
- -0.5192
- p-value
- 0
- Sample size (n)
- 252
- 95% confidence interval
- -0.6327 to -0.4601
- Granger causality
- None
- Granger optimal lag
- 1
AI analysis
Analysis: S&P 500 Close Price vs. U.S. Equities Total Trade Count (2015)
1. Relationship Overview The scatterplot reveals a negative relationship between the S&P 500 daily closing price (X) and the total trade count across U.S. equity exchanges (Y). As the S&P 500 close price increases, the total number of trades tends to decrease, and vice versa. This inverse pattern is somewhat counterintuitive at first glance — one might expect higher prices to attract more trading activity — but it reflects a meaningful market dynamic that characterized 2015 specifically, where market stress and declining prices coincided with elevated trading volumes and fragmentation across venues.
2. Correlation Strength and Statistical Significance The Pearson correlation of r = -0.5523 indicates a moderate negative linear association. The r² of 0.3050 means that approximately 30.5% of the variance in total trade count is explained by the S&P 500 closing price — a non-trivial but clearly incomplete explanation, leaving roughly 70% of variance attributable to other factors. The 95% confidence interval of [-0.6327, -0.4601] is entirely negative and relatively tight, providing strong statistical confidence that the true population correlation is meaningfully negative. With a p-value effectively at zero across a sample of 252 paired observations drawn from a population of 3,302, the relationship is highly statistically significant and not a sampling artifact. However, the Granger causality results are notably absent — neither direction (X→Y: F=0.29, p=0.59; Y→X: F=0.41, p=0.52) achieves significance at any conventional threshold. This is critical: despite a robust contemporaneous correlation, neither variable temporally predicts the other at a one-period lag, meaning the relationship does not imply a leading/lagging causal mechanism. The two variables appear to move together contemporaneously, likely driven by shared underlying conditions rather than one causing the other.
3. Notable Patterns, Clusters, and Outliers Several structural features stand out in the data: - A dense central cluster exists around X ≈ 2,050–2,550 (the S&P's primary trading range in 2015) and Y ≈ 2,050–2,130 trade count units, representing normal market conditions. - A lower-right dispersion is visible where higher index values correspond to noticeably lower trade counts, reinforcing the negative slope. - Outliers at low Y values — particularly the point near (4,083,022, 1,867.61) and several points around X ≈ 3,900–4,100 — appear to represent the August 2015 market correction, when the S&P 500 dropped sharply. These points sit far from the central cluster and likely represent specific high-stress sessions. - The point (997,371, ~2,061) is a notable low-X outlier, suggesting an unusually low-volume day that may reflect a holiday or data anomaly. - The regression line y = -6.515×10⁻⁵x + 2,223.03 captures the general trend, but the scatter around it is substantial, visually confirming that linear fit explains only ~30% of variance.
4. Confounding Factors and Caveats Several important caveats apply to interpreting this correlation: - Market regime effects: 2015 included the August flash crash and significant volatility episodes. These events simultaneously depressed prices and elevated trade counts, which may be driving much of the observed correlation — meaning the relationship is partly an artifact of a specific, turbulent year rather than a structural market law. - Trade count ≠ volume: Total trade count reflects fragmentation across exchanges and the rise of high-frequency trading; it does not directly equate to market participation depth or liquidity quality. - Omitted variables: VIX (implied volatility), macroeconomic announcements, Federal Reserve communications, and options expiration calendars all influence both variables independently and are not controlled for here. - Non-linearity: The scatter suggests the relationship may not be uniformly linear — the negative association appears stronger in extreme price decline regimes than in normal conditions, hinting at a regime-dependent or threshold effect. - Temporal autocorrelation: Daily financial time series are rarely i.i.d., and both variables likely exhibit serial correlation, which can inflate the apparent statistical significance of the correlation even with a large sample.
5. Actionable Insights and Further Investigation - Segment the analysis by market regime: Separating calm periods from high-volatility episodes (e.g., using VIX thresholds) would test whether the negative correlation is regime-specific or consistent throughout the year. - Extend the time horizon: Replicating this analysis across multiple years would determine whether the 2015 negative relationship is a persistent structural feature or a period-specific anomaly. - Include volatility controls: Adding VIX or realized volatility as a covariate could substantially increase explained variance and clarify whether price level or price uncertainty is the more meaningful driver of trade count. - Explore non-linear models: Given the visible heteroscedasticity and potential threshold behavior, a spline regression or quantile regression approach may better characterize the relationship across different market conditions. - Investigate exchange-level data: Disaggregating total trade count by exchange or trade type (lit vs. dark pools) could reveal whether the inverse relationship is driven by specific venue behavior during stress episodes.
X dataset: Cboe U.S. Equities Historical Market Volume Data 2015
Y dataset: S&P 500 Daily Time Series since 1927 (GitHub fja05680) (Date)
Part of experiment: Daily - Cboe U.S. Equities Historical Market Volume Data 2015 vs S&P 500 Daily Time Series since 1927 (GitHub fja05680) (Date)