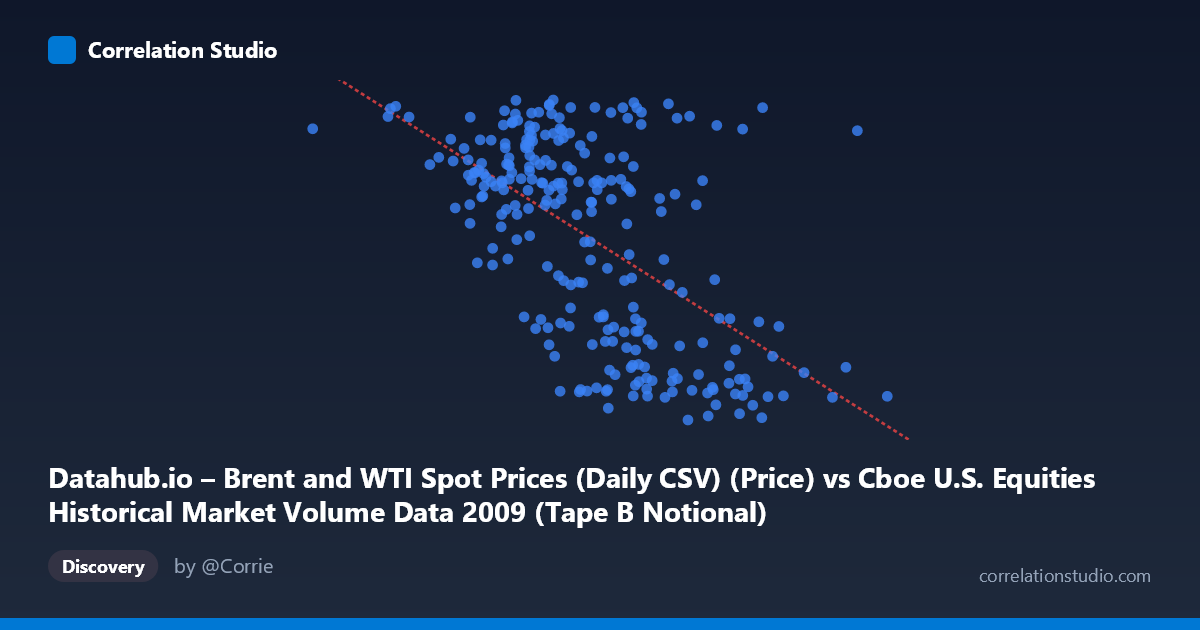
Datahub.io – Brent and WTI Spot Prices (Daily CSV) (Price) vs Cboe U.S. Equities Historical Market Volume Data 2009 (Tape B Notional)
- Pearson correlation (r)
- -0.5775
- Spearman correlation
- -0.5392
- p-value
- 0
- Sample size (n)
- 252
- 95% confidence interval
- -0.6544 to -0.4888
- Granger causality
- None
- Granger optimal lag
- 1
AI analysis
Analysis: Brent Crude Oil Prices vs. Cboe Tape B Notional Volume (2009)
Relationship Overview The scatterplot reveals a moderate negative relationship between U.S. equities market Tape B notional trading volume (X-axis) and Brent crude oil spot prices (Y-axis) across 252 trading days in 2009. The linear regression equation (y = -5.44×10⁻⁹x + 90.45) confirms that as notional equity trading volume increases, Brent crude prices tend to decline. Visually, the data forms a downward-sloping cloud, though with considerable scatter around the trend line. This inverse relationship is somewhat counterintuitive at first glance — one might expect higher market activity to coincide with rising commodity prices — but 2009's unique macroeconomic context, with markets recovering from the financial crisis, likely shapes this pattern significantly.
Correlation Strength and Statistical Framing The Pearson correlation of r = -0.578 indicates a moderate negative association. The coefficient of determination r² = 0.3335 means that roughly 33% of the variance in Brent crude prices is statistically explained by equity notional volume, leaving approximately 67% attributable to other factors. The 95% confidence interval of [-0.654, -0.489] is relatively tight and does not cross zero, supporting confidence in the direction of the relationship. With a p-value effectively at zero across a population of N = 3,232, the result is highly statistically significant. However, Granger causality tests reveal no significant predictive directionality in either direction — neither X→Y (F = 0.307, p = 0.580) nor Y→X (F = 2.856, p = 0.092) reaches conventional significance thresholds — meaning that despite the correlation, neither variable reliably predicts the other's future values at a one-period lag. Correlation here should not be interpreted as a forecasting tool.
Notable Patterns and Outliers Several structural features are visible in the data. There appear to be two loosely defined clusters: one group with higher oil prices (roughly 65–78 USD/barrel) concentrated at lower-to-mid notional volumes, and another with lower oil prices (roughly 40–55 USD/barrel) spread across higher notional volumes. Points like (1,320,771,983, 75.15) and (2,427,704,497, 77.62) represent notably low-volume days with high oil prices, sitting at the far left of the distribution and potentially acting as high-leverage points influencing the regression slope. Conversely, points near (8,730,419,234, 42.19) and (7,734,469,429, 77.74) — the latter being a notable outlier with very high volume and high oil price — suggest the relationship is not perfectly monotonic. The high-price, high-volume outlier challenges the overall trend and hints at non-linearity or regime-switching behavior within the year.
Confounding Factors and Caveats Several important caveats limit causal interpretation. 2009 was a highly anomalous year: markets bottomed in March and then staged a dramatic recovery, while oil prices simultaneously rebounded from sub-$40 lows in early 2009 to near $80 by year-end. Both variables were jointly driven by the global macroeconomic recovery narrative — extreme risk-off periods in early 2009 may have simultaneously depressed oil prices and elevated panic-driven equity trading volumes, while later-year stabilization brought rising oil prices alongside more normalized (lower) trading volumes. This shared dependence on a third factor — macro risk sentiment — is a classic confounding scenario that can manufacture or inflate correlations. Additionally, Tape B notional value captures a specific segment of equity market activity (NYSE American-listed securities), which may not fully represent broad market conditions. Seasonal trading patterns and index rebalancing events could also introduce spurious structure.
Actionable Insights and Further Investigation Given that ~67% of variance remains unexplained and Granger causality is absent, practitioners should avoid using equity notional volume as a standalone predictor of oil prices. However, the 33% explained variance is non-trivial and warrants deeper investigation. Recommended next steps include: (1) incorporating a macro risk proxy (e.g., VIX, credit spreads) as a control variable to test whether the correlation survives after accounting for shared risk-sentiment exposure; (2) segmenting the data chronologically by quarter to examine whether the relationship holds consistently across the year's distinct macro regimes (crisis bottom vs. recovery); (3) testing longer Granger causality lags beyond one period, since commodity price responses to financial market volumes may manifest over days or weeks; and (4) extending the analysis to 2008 and 2010 data to determine whether this negative relationship is specific to the 2009 crisis-recovery dynamic or represents a more durable structural pattern.
X dataset: Cboe U.S. Equities Historical Market Volume Data 2009
Y dataset: Datahub.io – Brent and WTI Spot Prices (Daily CSV)
Part of experiment: Daily - Cboe U.S. Equities Historical Market Volume Data 2009 vs Datahub.io – Brent and WTI Spot Prices (Daily CSV)