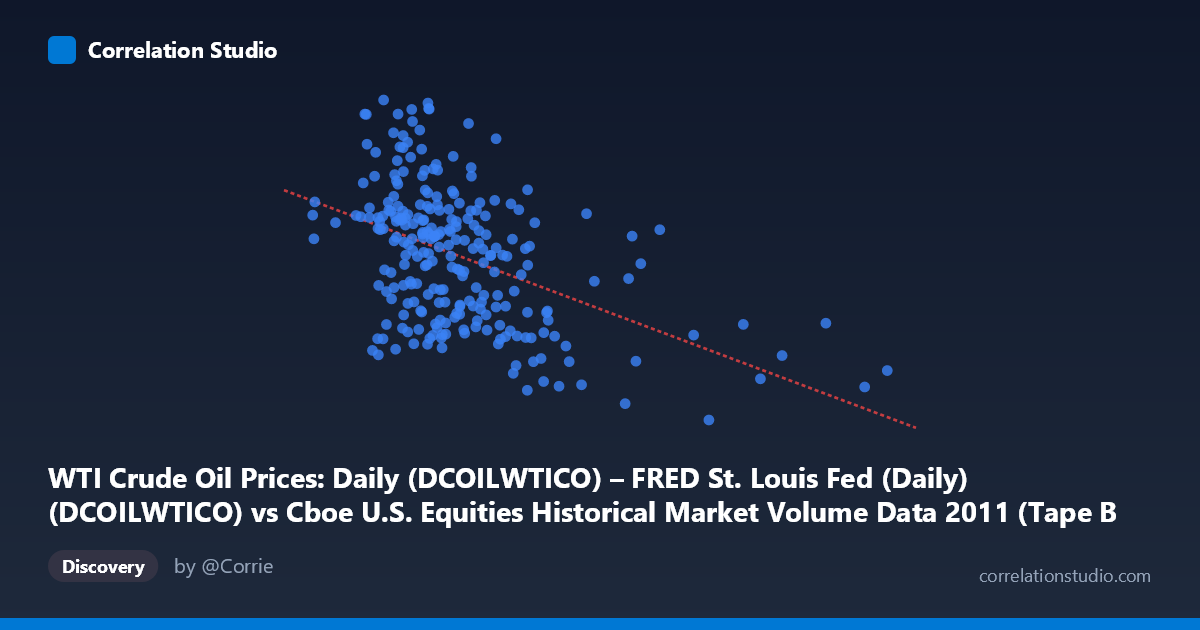
WTI Crude Oil Prices: Daily (DCOILWTICO) – FRED St. Louis Fed (Daily) (DCOILWTICO) vs Cboe U.S. Equities Historical Market Volume Data 2011 (Tape B Shares)
- Pearson correlation (r)
- -0.4664
- Spearman correlation
- -0.4474
- p-value
- 0
- Sample size (n)
- 252
- 95% confidence interval
- -0.5579 to -0.3638
- Granger causality
- None
- Granger optimal lag
- 1
AI analysis
Analysis: WTI Crude Oil Prices vs. Cboe Tape B Share Volume (2011)
Relationship Overview The scatterplot reveals a moderate negative relationship between WTI crude oil prices (X-axis) and Cboe Tape B share volume (Y-axis) across 252 trading days in 2011. As crude oil prices rise, equity share volume on Tape B exchanges tends to decline. The linear regression equation (y = -1.14472E-07x + 106.116) confirms this inverse slope, suggesting that for every ~$8.74 increase in oil price (roughly one standard deviation), Tape B volume decreases by approximately one unit. This pattern is visually consistent with a broadly dispersed cloud tilting downward from left to right, though with considerable scatter throughout.
Correlation Strength and Statistical Significance The Pearson correlation of r = -0.4664 indicates a moderate negative association, but the coefficient of determination r² = 0.2176 is the more sobering metric — only 21.8% of the variance in Tape B volume is explained by oil price levels. The remaining ~78% is attributable to other factors entirely. The 95% confidence interval of [-0.5579, -0.3638] is meaningfully bounded away from zero, and the p-value of 5.107E-15 confirms this is statistically significant well beyond conventional thresholds, particularly credible given the population context of N = 3,780. However, statistical significance here largely reflects sample size rather than practical magnitude. Critically, Granger causality tests find no significant predictive directionality in either direction (X→Y: F = 0.030, p = 0.863; Y→X: F = 2.861, p = 0.092), meaning oil prices do not temporally predict volume nor vice versa at the one-period lag tested. The correlation captures a contemporaneous association, not a predictive or causal mechanism.
Notable Patterns, Clusters, and Outliers The data cloud shows several noteworthy structural features. There is a visible dense cluster between roughly $75–110/barrel and 85–105 volume units, where the bulk of 2011 trading days resided. However, several outliers are apparent: points near $62–65/barrel with volume exceeding 108–111 (lower-left high-volume region) suggest that when oil was at its cheapest in 2011, equity volume spiked notably — potentially reflecting the market volatility associated with oil price drops. Conversely, points at $165–190/barrel show moderate volume (~85–98), consistent with the negative trend but with relatively low dispersion, suggesting volume compression at elevated oil prices. The relationship also appears heteroscedastic — variance in Y appears wider at lower X values and narrows at higher price levels, which violates a key assumption of ordinary least squares regression and warrants caution in the linear model's reliability.
Confounding Factors and Interpretive Caveats Several important caveats limit causal interpretation. 2011 was an atypical year — it encompassed the Arab Spring (driving oil volatility), the U.S. debt ceiling crisis (August 2011 triggered massive equity volume spikes), and European sovereign debt contagion, all of which simultaneously affected both oil prices and equity trading activity through independent channels. Tape B specifically represents regional exchange volume (NYSE Arca, NYSE American), which may respond differently to macro conditions than broader market volume. The axis labels also appear to be swapped in the dataset metadata (WTI prices are labeled as the Y-axis source description and vice versa), warranting data pipeline verification. Furthermore, the Granger causality null result strongly suggests any observed correlation is driven by common third-factor exposure — macro risk sentiment, Federal Reserve policy, or global growth expectations — rather than any direct oil-to-volume mechanism.
Actionable Insights and Further Investigation Given that oil prices explain only ~22% of volume variance with no temporal predictive power, practitioners should avoid using oil prices as a standalone trading volume predictor. More productive next steps would include: (1) incorporating VIX (volatility index) as a covariate, since fear-driven volatility likely explains a large portion of the remaining variance; (2) testing multivariate models combining oil prices with credit spreads, USD index, and equity index returns to decompose the common macro factor; (3) investigating the August 2011 debt-ceiling period as a structural break — subsetting pre/post-August data may reveal that the correlation is regime-dependent rather than stable; and (4) replicating the analysis across Tape A and Tape C volume to determine whether the Tape B result is exchange-specific or market-wide. The Granger non-result also suggests that same-day or intraday analysis may be more informative than daily-lag frameworks for any operational signal extraction.
X dataset: Cboe U.S. Equities Historical Market Volume Data 2011
Y dataset: WTI Crude Oil Prices: Daily (DCOILWTICO) – FRED St. Louis Fed (Daily)
Part of experiment: Daily - Cboe U.S. Equities Historical Market Volume Data 2011 vs WTI Crude Oil Prices: Daily (DCOILWTICO) – FRED St. Louis Fed (Daily)