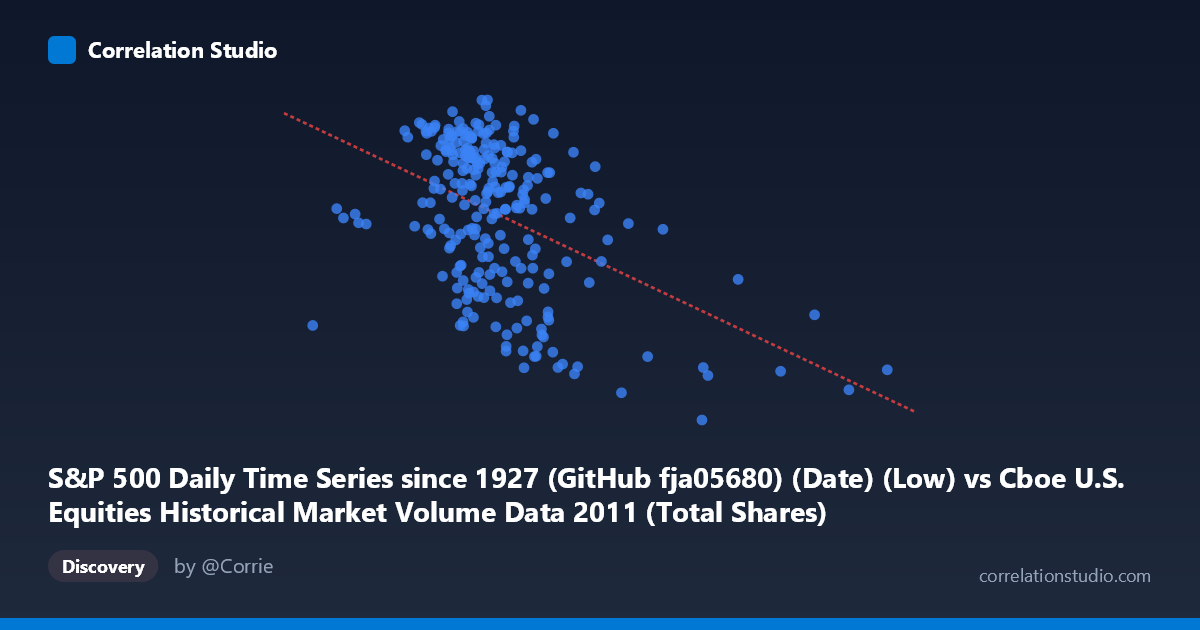
S&P 500 Daily Time Series since 1927 (GitHub fja05680) (Date) (Low) vs Cboe U.S. Equities Historical Market Volume Data 2011 (Total Shares)
- Pearson correlation (r)
- -0.4504
- Spearman correlation
- -0.3908
- p-value
- 0
- Sample size (n)
- 252
- 95% confidence interval
- -0.5437 to -0.3461
- Granger causality
- None
- Granger optimal lag
- 1
AI analysis
Scatterplot Analysis: S&P 500 Daily Low vs. Total Shares Traded (2011)
Relationship Overview The scatterplot reveals a negative relationship between the S&P 500 daily low price (X-axis) and total shares traded on U.S. equities exchanges (Y-axis) across 252 trading days in 2011. As the daily low price increases, total share volume tends to decrease — a pattern that reflects a well-documented market dynamic: higher-priced market environments often coincide with calmer, lower-volume sessions, while price dislocations and drawdowns tend to attract elevated trading activity. The linear regression equation (y = −2.42×10⁻⁷x + 1383.66) captures this negative slope, though the relationship is clearly noisy and far from deterministic.
Correlation Strength, Direction, and Causality The Pearson correlation of r = −0.4504 indicates a moderate negative association, but the explanatory power is modest: r² = 0.2029 means only ~20.3% of the variance in total shares traded is explained by the S&P 500 daily low. The remaining ~80% is attributable to other factors entirely. The 95% confidence interval of [−0.5437, −0.3461] is entirely negative and does not cross zero, confirming the direction of the relationship is robust, while the p-value of 5.4×10⁻¹⁴ — derived from a population of N = 3,780 — makes it statistically near-certain this is not a chance finding. However, Granger causality tests reveal no significant temporal predictive direction in either direction (X→Y: F = 0.075, p = 0.784; Y→X: F = 0.049, p = 0.825). This is a critical caveat: while the contemporaneous correlation is real and significant, neither variable reliably predicts the other the following day. The relationship is associative, not predictive in a lagged sense.
Notable Patterns, Clusters, and Outliers Several features stand out in the data. The bulk of observations cluster between roughly 400M–600M on the X-axis and 1,200–1,350 shares on the Y-axis, forming a dense core. However, a small but visible group of outliers sits at higher price lows (700M–900M+) with notably lower share volumes (~1,100–1,250), pulling the regression line and driving much of the negative correlation. Points like (878M, 1121) and (808M, 1244) are particularly influential. On the lower-price end, observations don't uniformly show very high volumes, suggesting the relationship weakens at extreme values. There is also notable vertical spread at any given X value — for example, at ~500M, Y values span from roughly 1,175 to 1,335 — indicating substantial unexplained variance consistent with the low r².
Confounding Factors and Caveats Several important caveats apply. First, 2011 was a turbulent year marked by the U.S. debt ceiling crisis, the S&P credit rating downgrade in August, and European sovereign debt contagion — episodes that simultaneously depressed prices and spiked volumes, potentially inflating the negative correlation beyond its structural magnitude. Second, the datasets are being joined on date as a key, meaning the correlation is contemporaneous and sensitive to calendar alignment; any mismatch in trading days or data sources could introduce noise. Third, share count as a volume metric is price-sensitive itself — when prices fall, index-level share counts may mechanically increase as investors rotate or rebalance, creating a partly mathematical negative relationship rather than a purely behavioral one. Finally, using the daily low rather than close or open introduces selection bias toward intraday extremes.
Actionable Insights and Further Investigation Despite the lack of Granger causality, the contemporaneous negative correlation has practical relevance for risk monitoring: days with sharp intraday low readings tend to coincide with elevated market activity, which affects liquidity, bid-ask spreads, and execution costs. Practitioners should investigate whether this relationship strengthens during specific volatility regimes (e.g., VIX above 25) by segmenting the data. A nonlinear model (e.g., quadratic or piecewise regression) may better capture the relationship, particularly at price extremes. It would also be valuable to replace share count with notional value (shares × price) to disentangle mechanical price effects from genuine behavioral trading responses. Finally, extending the analysis to multiple years would test whether 2011's crisis dynamics are structurally representative or anomalous.
X dataset: Cboe U.S. Equities Historical Market Volume Data 2011
Y dataset: S&P 500 Daily Time Series since 1927 (GitHub fja05680) (Date)
Part of experiment: Daily - Cboe U.S. Equities Historical Market Volume Data 2011 vs S&P 500 Daily Time Series since 1927 (GitHub fja05680) (Date)