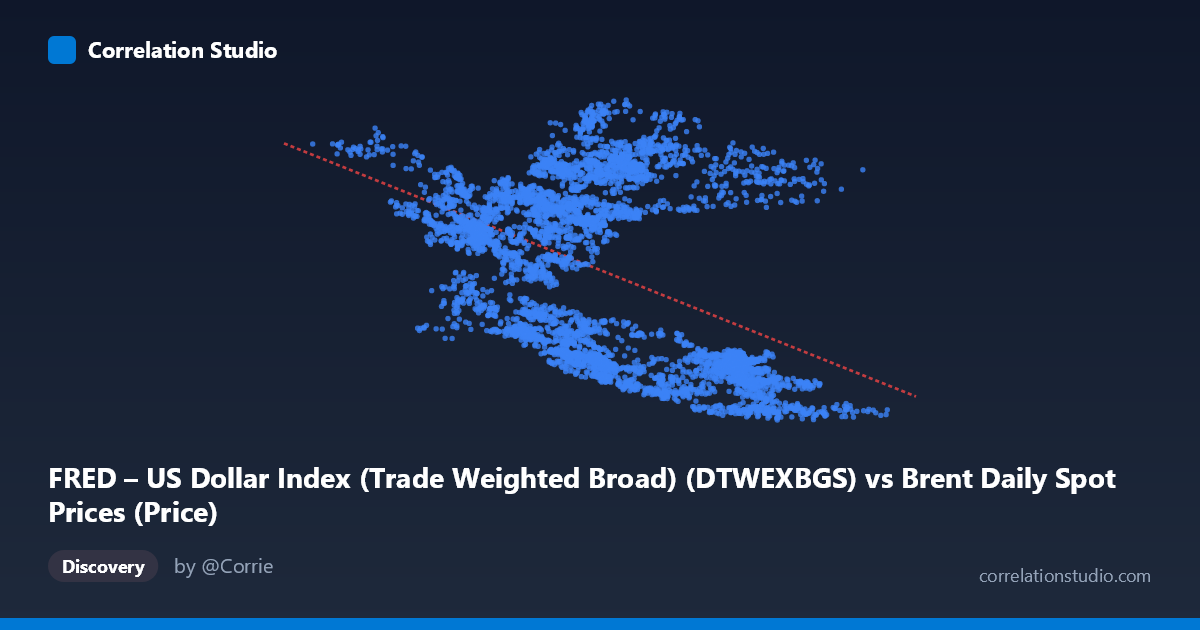
FRED – US Dollar Index (Trade Weighted Broad) (DTWEXBGS) vs Brent Daily Spot Prices (Price)
- Pearson correlation (r)
- -0.4595
- Spearman correlation
- -0.3941
- p-value
- 0
- Sample size (n)
- 5021
- 95% confidence interval
- -0.481 to -0.4374
- Granger causality
- None
- Granger optimal lag
- 1
AI analysis
Brent Crude Oil Price vs. US Dollar Index: Correlation Analysis
Relationship Overview
The scatterplot reveals a moderate negative relationship between the Trade-Weighted Broad US Dollar Index (X-axis) and Brent crude oil spot prices (Y-axis), consistent with the well-established inverse dynamic between dollar strength and commodity prices. As the dollar index rises, Brent prices tend to fall, and vice versa. The linear regression equation (y = -0.238x + 124.57) quantifies this: for every one-unit increase in the dollar index, Brent prices decline by approximately $0.24/barrel on average. The data spans a substantial 20-year period (2006–2026), capturing multiple oil price cycles, dollar regime shifts, and macroeconomic shocks, lending the relationship historical breadth but also introducing considerable structural heterogeneity.
Correlation Strength and Statistical Significance
The correlation coefficient of r = -0.4595 indicates a moderate negative association, but the explanatory power is notably limited: R² = 0.2111 means only ~21% of the variance in Brent prices is explained by the dollar index, leaving roughly 79% attributable to other forces. The 95% confidence interval of [-0.481, -0.437] is narrow and does not cross zero, and the p-value of effectively 0 across 5,021 paired observations confirms this relationship is highly statistically significant and not a sampling artifact. However, statistical significance here should not be conflated with practical or predictive significance — the wide scatter around the regression line makes point forecasting unreliable. Critically, the Granger causality tests reveal no significant predictive direction in either direction (X→Y: F=0.127, p=0.722; Y→X: F=1.303, p=0.254), meaning that past values of the dollar index do not meaningfully improve short-term forecasts of Brent prices beyond what Brent's own history provides, and vice versa at the tested lag of 1 period. This challenges any simple narrative of the dollar "causing" oil price movements on a day-to-day basis.
Notable Patterns, Clusters, and Outliers
Several distinct structural features are visible in the sample points. There appear to be at least two or three loose clusters: one in the upper-left region (low dollar index ~40–75, higher Brent prices ~110–128), consistent with the weak-dollar/high-oil-price environments of 2007–2008 and 2010–2014; a second dense cluster in the lower-right (high dollar index ~105–135, lower Brent prices ~86–94), reflecting post-2022 dollar strength coinciding with oil price normalization; and a more dispersed middle zone suggesting transitional periods. Points like (113.95, 122.47) and (90.73, 123.41) stand out as notable outliers — relatively high dollar readings paired with elevated Brent prices — potentially corresponding to the 2022 energy shock when geopolitical factors (Russia-Ukraine war) temporarily overwhelmed the typical inverse dynamic. The vertical spread at any given X value is substantial, reinforcing that the dollar is only one of many price drivers.
Confounding Factors and Interpretive Caveats
Several important caveats apply. First, causality is bidirectional in theory — oil prices influence inflation and current accounts, which in turn affect the dollar — yet the Granger test finds neither direction dominates at a 1-day lag, suggesting the relationship may operate at longer structural timescales or through indirect channels. Second, the 20-year window encompasses vastly different regimes: the pre-GFC commodity supercycle, the 2008 crash, quantitative easing eras, COVID demand collapse, and the 2022 energy crisis, each with distinct supply-demand-currency dynamics that may not be stable over time. Third, oil is priced in dollars globally, creating a mechanical accounting relationship that may partly explain the correlation without implying genuine economic causation. Finally, OPEC+ supply management, geopolitical risk premia, and global growth expectations are all significant omitted variables that likely explain much of the residual 79% variance.
Actionable Insights and Further Investigation
Practitioners should treat the dollar index as a contextual signal rather than a reliable short-term predictor of Brent prices, given the weak Granger causality results. For further investigation, it would be valuable to: (1) test Granger causality at longer lags (weekly or monthly) where structural dollar-oil dynamics may be more pronounced; (2) segment the analysis by regime (pre/post-GFC, QE periods, post-COVID) to assess whether the correlation is stable or time-varying using rolling-window R² analysis; (3) incorporate a multiple regression framework adding OPEC production data, global PMI, and geopolitical risk indices to better capture the 79% unexplained variance; and (4) explore non-linear or threshold models, since the relationship may intensify only during extreme dollar moves. The outlier cluster around high-dollar/high-price episodes particularly warrants case-by-case examination to identify when geopolitical shocks structurally break the inverse relationship.
X dataset: Brent Daily Spot Prices
Y dataset: FRED – US Dollar Index (Trade Weighted Broad)
Part of experiment: Daily - Brent Daily Spot Prices vs FRED – US Dollar Index (Trade Weighted Broad)