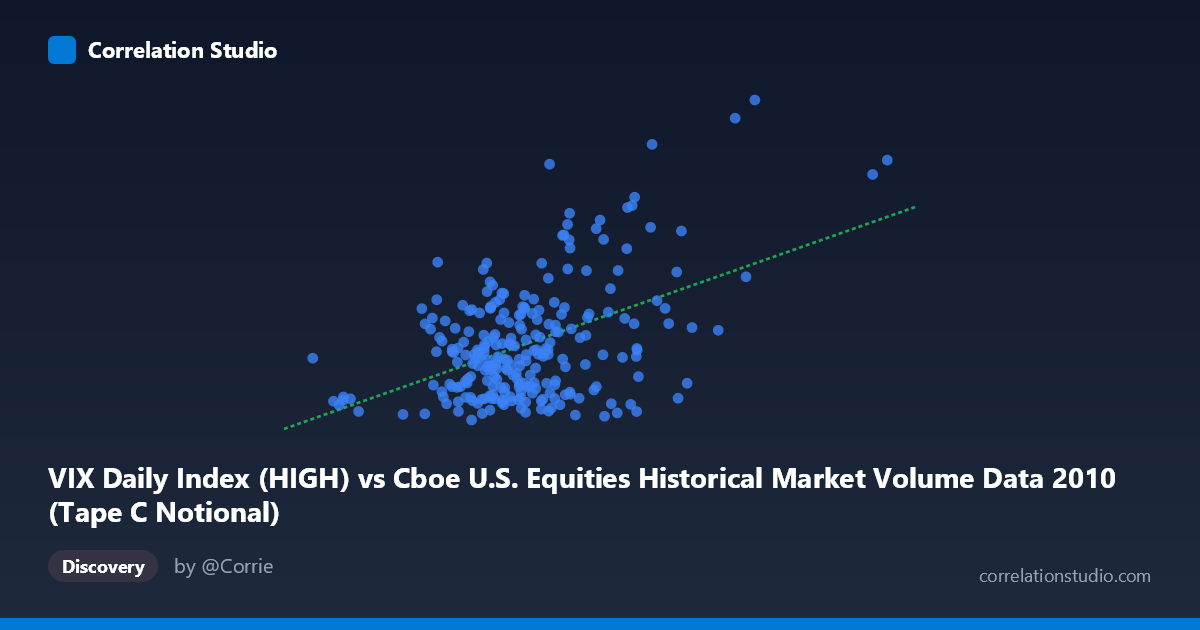
VIX Daily Index (HIGH) vs Cboe U.S. Equities Historical Market Volume Data 2010 (Tape C Notional)
- Pearson correlation (r)
- 0.4708
- Spearman correlation
- 0.2803
- p-value
- 0
- Sample size (n)
- 252
- 95% confidence interval
- 0.3687 to 0.5617
- Granger causality
- Y → X
- Granger optimal lag
- 1
AI analysis
Scatterplot Analysis: VIX High vs. Tape C Notional Volume (2010)
Relationship Overview
The scatterplot reveals a positive relationship between the CBOE VIX Daily Index (High) on the x-axis and Tape C Notional trading volume on the y-axis across U.S. equity markets in 2010. As VIX high values increase — reflecting greater implied market volatility — Tape C notional volume tends to rise correspondingly. This is economically intuitive: periods of elevated market fear or uncertainty typically drive heavier trading activity as investors reposition, hedge, or liquidate holdings. The linear regression equation (y = 2.80×10⁻⁹x + 12.70) confirms this positive slope, though the substantial vertical scatter around the regression line signals that the relationship is far from deterministic.
Correlation Strength and Statistical Significance
The Pearson correlation of r = 0.4708 indicates a moderate positive association, but the more telling statistic is r² = 0.2217, meaning VIX highs explain only about 22% of the variance in Tape C notional volume — leaving roughly 78% attributable to other factors. The 95% confidence interval for r spans [0.3687, 0.5617], a moderately wide band that reflects meaningful uncertainty, though the interval comfortably excludes zero. The p-value of 2.67×10⁻¹⁵ confirms the relationship is highly statistically significant given N = 3,302, making a spurious finding extremely unlikely. Critically, the Granger causality analysis points unidirectionally: Y Granger-causes X (F = 5.67, p = 0.018), while X→Y is non-significant (F = 1.85, p = 0.175). In practical terms, this suggests that past Tape C notional volume has predictive power over future VIX highs, not the reverse — a somewhat counterintuitive finding that warrants careful interpretation.
Notable Patterns, Clusters, and Outliers
The data cloud shows a broad fan-like dispersion that widens at higher VIX values, suggestive of heteroscedasticity — variability in Tape C volume grows as volatility increases, meaning the linear model's assumptions are strained at the extremes. Several visible outliers stand out: the point near (8.48B, 42.2) represents an extreme VIX reading paired with very high notional volume, likely corresponding to a specific market stress event in 2010 (possibly the May "Flash Crash"). The cluster near (6.81B, 48.2) is similarly anomalous. Conversely, a dense cluster of observations congregates at lower VIX values (roughly 2.5B–4.5B on X, 16–26 on Y), reflecting the calmer, range-bound trading days that dominated much of 2010 outside of episodic volatility spikes. The sample points also reveal several cases where moderate VIX readings accompany surprisingly high volume, suggesting other demand drivers at work.
Confounding Factors and Caveats
Several important caveats apply. First, the axis label assignment appears inverted relative to conventional expectations — VIX is typically treated as the independent variable driving volume, yet Granger causality suggests the reverse. This could reflect a data alignment artifact, labeling ambiguity, or genuine lagged feedback loops in market microstructure. Second, 2010 was an exceptional year containing the May 6th Flash Crash, European sovereign debt contagion fears, and Federal Reserve quantitative easing announcements — episodic events that simultaneously spiked both VIX and volume, potentially inflating the correlation. Third, Tape C represents only NYSE Arca-listed securities, so the notional volume metric is a partial measure of total market activity. Finally, the Granger causality result, while statistically significant at a 1-period lag, does not imply true economic causation — it may reflect a shared response to latent macro shocks rather than a genuine predictive mechanism.
Actionable Insights and Further Investigation
Practitioners could explore whether Tape C volume leads VIX as a real-time stress indicator, given the Granger result — elevated notional turnover in Arca-listed names may serve as an early-warning signal for volatility regimes. Further investigation should include: (1) non-linear modeling (e.g., log transformation of both variables or a polynomial fit) to better capture the heteroscedastic, fan-shaped spread; (2) event-window analysis isolating Flash Crash and FOMC announcement days to assess whether the correlation is largely episodic; (3) multivariate regression incorporating VIX open/close alongside macro controls (e.g., S&P 500 returns, bid-ask spreads) to better explain the 78% unexplained variance; and (4) replication across other Tape segments (A and B) to determine whether the volume-volatility relationship is specific to Arca or a broader market phenomenon.
X dataset: Cboe U.S. Equities Historical Market Volume Data 2010
Y dataset: VIX Daily Index
Part of experiment: Daily - Cboe U.S. Equities Historical Market Volume Data 2010 vs VIX Daily Index