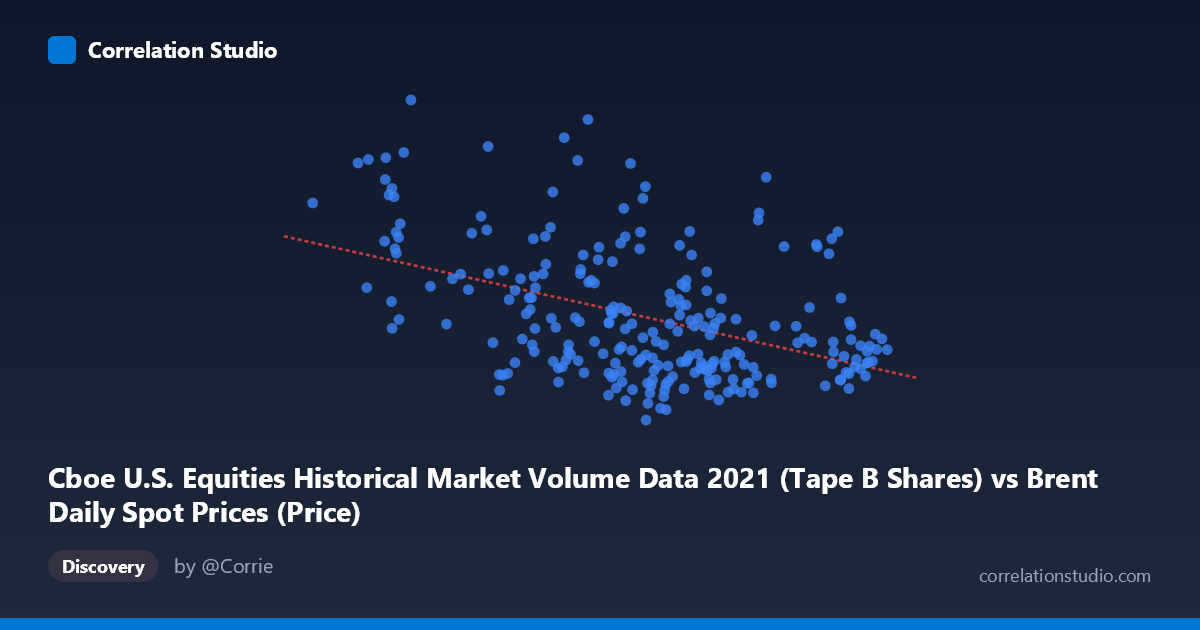
Cboe U.S. Equities Historical Market Volume Data 2021 (Tape B Shares) vs Brent Daily Spot Prices (Price)
- Pearson correlation (r)
- -0.4464
- Spearman correlation
- -0.3975
- p-value
- 0
- Sample size (n)
- 247
- 95% confidence interval
- -0.5411 to -0.3406
- Granger causality
- None
- Granger optimal lag
- 10
- Time coverage
- 2021-01-04 to 2021-12-31
- Recomputed on refreshed data
- 2026-10-22 (r was -0.4464)
AI analysis
Scatterplot Analysis: Brent Crude Oil Prices vs. Cboe Tape B Share Volume (2021)
Relationship Overview The scatterplot reveals a negative relationship between Europe Brent crude oil spot prices (X-axis, in USD/barrel) and Cboe U.S. Equities Tape B share volume (Y-axis). As oil prices increase across the observed range of roughly $50–$86/barrel, equity market volume on Tape B exchanges tends to decrease. The linear regression equation (y = −1,590,320x + 210,985,000) quantifies this inverse slope, suggesting that each $1 increase in Brent crude is associated with approximately 1.59 million fewer Tape B shares traded on a given day. This directional finding is intuitively plausible — rising energy costs can shift capital flows and dampen certain equity trading activity — though the relationship is far from deterministic given the wide scatter visible across the plot.
Correlation Strength and Statistical Significance The Pearson correlation of r = −0.4464 indicates a moderate negative association, but the coefficient of determination (R² = 0.1993) tells a more sobering story: only about 20% of the variance in Tape B share volume is explained by Brent crude prices, leaving roughly 80% attributable to other factors entirely. The 95% confidence interval for r of [−0.5411, −0.3406] is entirely negative and does not cross zero, reinforcing the directional consistency of the finding. The p-value of 1.676×10⁻¹³ confirms the result is highly statistically significant given the sample size of n = 247 daily observations drawn from a population of N = 4,788. However, statistical significance here should not be conflated with practical or causal significance — large samples can render even modest correlations highly significant without implying meaningful predictive power.
Granger Causality and Temporal Predictive Direction Perhaps the most critical finding for any practical application is the complete absence of Granger causality in either direction. Neither X→Y (F = 0.7118, p = 0.7129) nor Y→X (F = 0.7249, p = 0.7006) reaches statistical significance, even at an optimal lag of 10 trading periods. This means that past values of Brent crude prices do not meaningfully help forecast future Tape B volume, and vice versa. The correlation observed is therefore contemporaneous and associative rather than temporally predictive — a crucial distinction for anyone considering using one variable to anticipate movements in the other. This effectively rules out simple time-lagged trading strategies or early-warning frameworks built on this pair alone.
Notable Patterns, Outliers, and Data Caveats The scatterplot exhibits considerable vertical dispersion at nearly every X value, indicating high day-to-day variability in Tape B volume regardless of oil price level. Several notable outliers are visible — for example, a data point near (70.90, ~53.3M shares) sits well below the regression line, while points near (70.0, ~165.5M) and (66.7, ~166.9M) sit far above it, suggesting episodic volume spikes unrelated to oil prices. There is also a notable dataset labeling anomaly worth flagging: the X-axis column is labeled as originating from the "Brent Daily Spot Prices" dataset, yet its description references Cboe volume data (Tape B Shares), and vice versa for the Y-axis. This apparent metadata mismatch should be verified before drawing firm conclusions, as a column assignment error could alter the interpretation entirely.
Confounding Factors and Further Investigation The observed correlation is almost certainly influenced by a range of confounding variables, including broader macroeconomic conditions in 2021 (post-COVID recovery dynamics, Federal Reserve policy signals, inflation concerns), sector rotation in equities, and the fact that Tape B specifically covers regional exchange volume rather than total market activity. The year 2021 saw Brent prices rise substantially from ~$50 to ~$86/barrel, coinciding with evolving pandemic recovery patterns that independently affected equity trading volumes. For further investigation, it would be valuable to: (1) control for broader market volatility (VIX) as a confound; (2) disaggregate volume by sector to test whether energy-related equities drive the relationship; (3) extend the time series beyond 2021 to test whether the negative correlation is a stable, multi-year feature or an artifact of this specific macroeconomic episode; and (4) resolve the dataset column labeling discrepancy to ensure the analysis reflects the intended variables.
X dataset: Brent Daily Spot Prices
Y dataset: Cboe U.S. Equities Historical Market Volume Data 2021
Part of experiment: Daily - Brent Daily Spot Prices vs Cboe U.S. Equities Historical Market Volume Data 2021