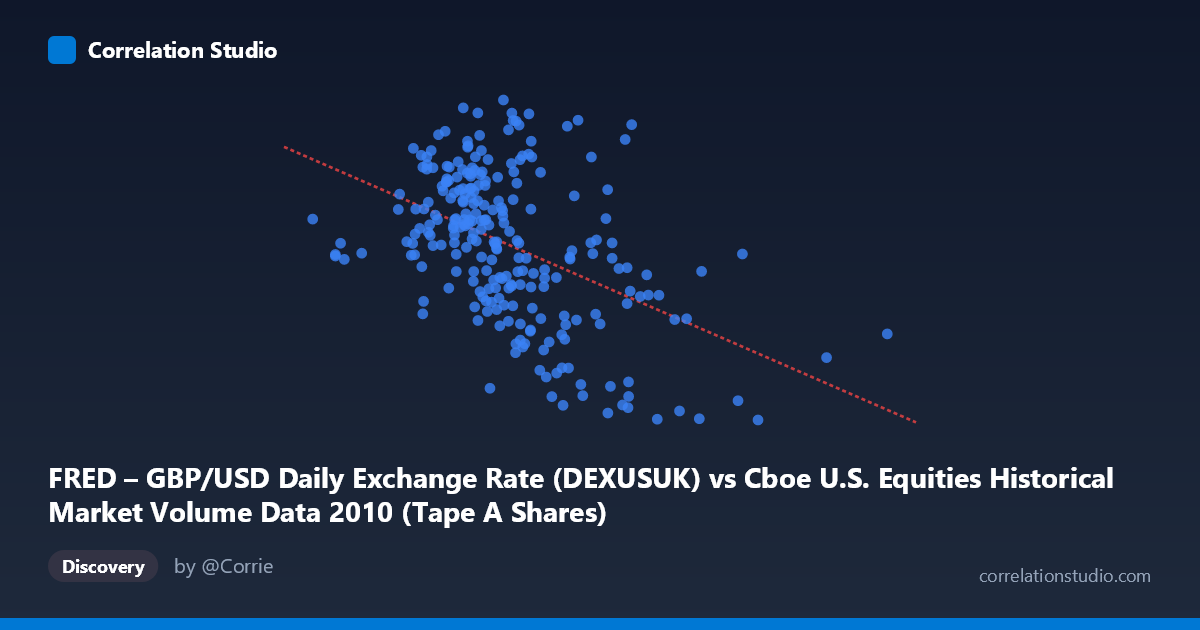
FRED – GBP/USD Daily Exchange Rate (DEXUSUK) vs Cboe U.S. Equities Historical Market Volume Data 2010 (Tape A Shares)
- Pearson correlation (r)
- -0.4659
- Spearman correlation
- -0.4552
- p-value
- 0
- Sample size (n)
- 249
- 95% confidence interval
- -0.5579 to -0.3625
- Granger causality
- None
- Granger optimal lag
- 1
AI analysis
Scatterplot Analysis: GBP/USD Exchange Rate vs. U.S. Equity Market Volume (2010)
Relationship Overview
The scatterplot reveals a moderate negative relationship between U.S. equity market trading volume (X-axis, measured in shares on Tape A) and the GBP/USD daily exchange rate (Y-axis). As trading volume increases, the pound sterling tends to weaken relative to the U.S. dollar — or equivalently, higher dollar volume days correspond to a lower GBP/USD rate. The linear regression equation (y = -2.01366E-10x + 1.62109) confirms this downward slope, though the scatter around the regression line is substantial, indicating that volume alone is far from a complete explanation of exchange rate movements. The data spans the full 2010 calendar year across 249 paired observations drawn from a population of 3,302 records.
Correlation Strength and Statistical Significance
The Pearson correlation of r = -0.4659 indicates a moderate negative association, but the explanatory power is modest: r² = 0.2170 means only 21.7% of the variance in GBP/USD is explained by equity market volume, leaving roughly 78% attributable to other factors. The 95% confidence interval of [-0.5579, -0.3625] is entirely negative and does not include zero, reinforcing that the direction of the relationship is reliable. The p-value of 8.216E-15 is extraordinarily small, confirming the correlation is highly statistically significant given the sample size of 249. However, statistical significance should not be conflated with practical significance — the Granger causality results are particularly sobering here: neither direction of temporal predictive causality reaches conventional significance (X→Y: F = 0.3573, p = 0.5506; Y→X: F = 3.6640, p = 0.0568). The Y→X direction approaches but does not cross the p < 0.05 threshold, weakly hinting that GBP/USD movements may have some marginal predictive relationship with subsequent volume, but this is insufficient to assert directional causation with confidence.
Notable Patterns, Clusters, and Outliers
Several structural features stand out in the data. The bulk of observations cluster between approximately 250M–550M shares and 1.48–1.62 GBP/USD, forming a moderately dense central cloud where the negative trend is most visible. There are notable high-volume outliers extending toward 637M–895M shares, which tend to occur at relatively lower GBP/USD values (around 1.43–1.54), pulling the regression line downward and driving much of the observed correlation. Conversely, a cluster of lower-volume days (roughly 138M–265M shares) appears at a range of GBP/USD values without strongly favoring the higher end, suggesting heteroscedasticity — the variance in exchange rates appears somewhat compressed at very low volumes. One point near 138M shares at 1.54 stands out as an extreme low-volume observation and warrants investigation as a potential anomaly (holiday-shortened trading session or data irregularity).
Confounding Factors and Interpretive Caveats
This correlation almost certainly reflects shared sensitivity to macroeconomic conditions rather than a direct mechanistic link between equity volume and currency rates. In 2010, global markets were navigating post-financial-crisis recovery, European sovereign debt concerns (the Greek bailout occurred in May 2010), and fluctuating risk appetite — all of which simultaneously drive both equity trading activity and GBP/USD movements. High-volume equity days often coincide with risk-off events that strengthen the U.S. dollar broadly, which would explain the negative correlation as a spurious byproduct of a common underlying driver (risk sentiment) rather than a causal relationship. Additionally, the dataset mixes directionality: Tape A shares represent NYSE-listed equity volume, which is a U.S.-centric metric, while GBP/USD reflects bilateral macro forces. Seasonal patterns in both series (thinner holiday trading, quarterly rebalancing) could also introduce correlated noise.
Actionable Insights and Further Investigation
Given the moderate but unexplained variance (78%) and the absence of Granger causality, practitioners should avoid using equity volume alone as a predictive signal for GBP/USD in any trading or hedging strategy. More productive next steps would include: (1) introducing risk sentiment proxies such as the VIX or credit spreads as control variables to test whether the correlation disappears once shared risk-off dynamics are accounted for; (2) segmenting the data by market regime (e.g., pre- and post-May 2010 European debt crisis) to test whether the correlation is stable or driven by a specific sub-period; (3) extending the Granger causality test to longer lags (2–5 periods) to ensure the single-lag result is not masking delayed predictive relationships; and (4) examining whether other currency pairs (EUR/USD in particular, given the European crisis) show stronger or weaker correlations with the same volume data, which would help isolate whether this finding is GBP-specific or a general dollar-strength phenomenon.
X dataset: Cboe U.S. Equities Historical Market Volume Data 2010
Y dataset: FRED – GBP/USD Daily Exchange Rate
Part of experiment: Daily - Cboe U.S. Equities Historical Market Volume Data 2010 vs FRED – GBP/USD Daily Exchange Rate