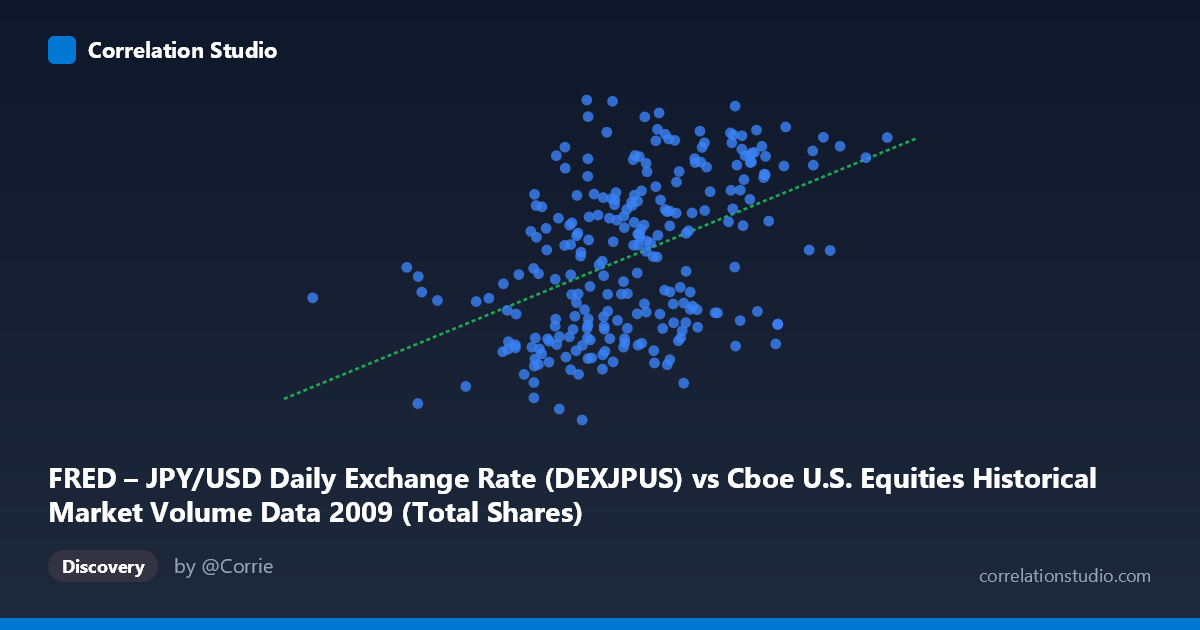
FRED – JPY/USD Daily Exchange Rate (DEXJPUS) vs Cboe U.S. Equities Historical Market Volume Data 2009 (Total Shares)
- Pearson correlation (r)
- 0.4583
- Spearman correlation
- 0.4633
- p-value
- 0
- Sample size (n)
- 250
- 95% confidence interval
- 0.3544 to 0.551
- Granger causality
- X → Y
- Granger optimal lag
- 2
AI analysis
Analysis: JPY/USD Exchange Rate vs. U.S. Equities Market Volume (2009)
Relationship Overview The scatterplot reveals a modest positive relationship between U.S. equities market trading volume (X-axis) and the JPY/USD daily exchange rate (Y-axis) across 2009. As trading volume increases, the yen tends to weaken slightly against the dollar (higher JPY/USD values indicate more yen per dollar, i.e., a weaker yen). The linear regression equation y = 1.057×10⁻⁸x + 85.59 describes a very shallow upward slope, reflecting that while the trend is real, the practical magnitude of volume's influence on exchange rate levels is small across the observed range. The scatter of points is notably wide, suggesting considerable unexplained variation around this trend line.
Correlation Strength and Statistical Significance The Pearson correlation of r = 0.4583 indicates a moderate positive association, but the coefficient of determination (R² = 0.2100) is the more sobering metric: only 21% of the variance in the JPY/USD rate is explained by U.S. equities volume, leaving 79% attributable to other factors. The 95% confidence interval for r [0.3544, 0.5510] is reasonably tight given n = 250 paired samples drawn from N = 3,232 observations, and the p-value of 2.20×10⁻¹⁴ confirms this correlation is highly unlikely to be a chance finding. Critically, the Granger causality test adds a temporal dimension: X Granger-causes Y unidirectionally (F = 4.857, p = 0.0085) at an optimal lag of 2 periods, meaning past trading volume has statistically meaningful predictive power for the exchange rate 2 days later, while the reverse direction (Y→X: F = 2.540, p = 0.081) fails to reach significance. This asymmetry suggests a directional signal worth taking seriously, even if it explains limited overall variance.
Notable Patterns and Features The sample points reveal a broad, somewhat heteroscedastic cloud rather than a tight linear band. Volume values cluster heavily in the 600M–950M share range, with the exchange rate spanning roughly 88–100 JPY/USD throughout. Several potential outliers are visible at the extremes: the maximum volume observation (≈1.21 billion shares, 99.00 JPY/USD) and minimum volume (≈192 million shares, 91.69 JPY/USD) both sit away from the central mass. Notably, high-volume days appear more frequently associated with JPY/USD values above 95, consistent with risk-on equity market conditions correlating with dollar strength. There is also a visible lower cluster of points around 88–91 JPY/USD that spans a wide range of volumes, hinting at possible regime changes or distinct sub-periods within 2009.
Confounding Factors and Caveats Several important caveats apply to this correlation. First, 2009 was an extraordinary year — spanning the depths of the Global Financial Crisis trough (March 2009) and the subsequent sharp equity recovery — meaning both variables were simultaneously driven by macro risk sentiment, creating classic confounding by a common cause. Risk-off episodes drove both lower equity volumes and yen strengthening (safe-haven flows), while risk-on recoveries drove higher volumes and yen weakening, which could mechanically inflate the observed correlation. Second, the axis labels appear to have been swapped in the dataset metadata (X is labeled as exchange rate data but described as volume, and vice versa), warranting a careful data audit before acting on directionality conclusions. Third, Granger causality establishes predictive precedence, not structural causation — volume may simply be a proxy for the same underlying sentiment driving currency moves.
Actionable Insights and Further Investigation Despite the caveats, the statistically significant Granger causality result at a 2-day lag is the most actionable finding here, suggesting that unusually high U.S. equity volume may serve as a short-term leading indicator of yen depreciation. Practitioners could investigate whether this signal persists out-of-sample or in other years. Recommended next steps include: (1) controlling for the VIX or broad risk sentiment indices to test whether the correlation survives after accounting for the common macro driver; (2) segmenting the data by sub-period (pre- vs. post-March 2009 market bottom) to check for structural breaks in the relationship; (3) verifying column assignments in the source datasets given the apparent metadata inconsistency; and (4) extending the Granger analysis across multiple lags and incorporating a VAR model to better characterize the dynamic relationship between equity market activity and currency movements.
X dataset: Cboe U.S. Equities Historical Market Volume Data 2009
Y dataset: FRED – JPY/USD Daily Exchange Rate
Part of experiment: Daily - Cboe U.S. Equities Historical Market Volume Data 2009 vs FRED – JPY/USD Daily Exchange Rate