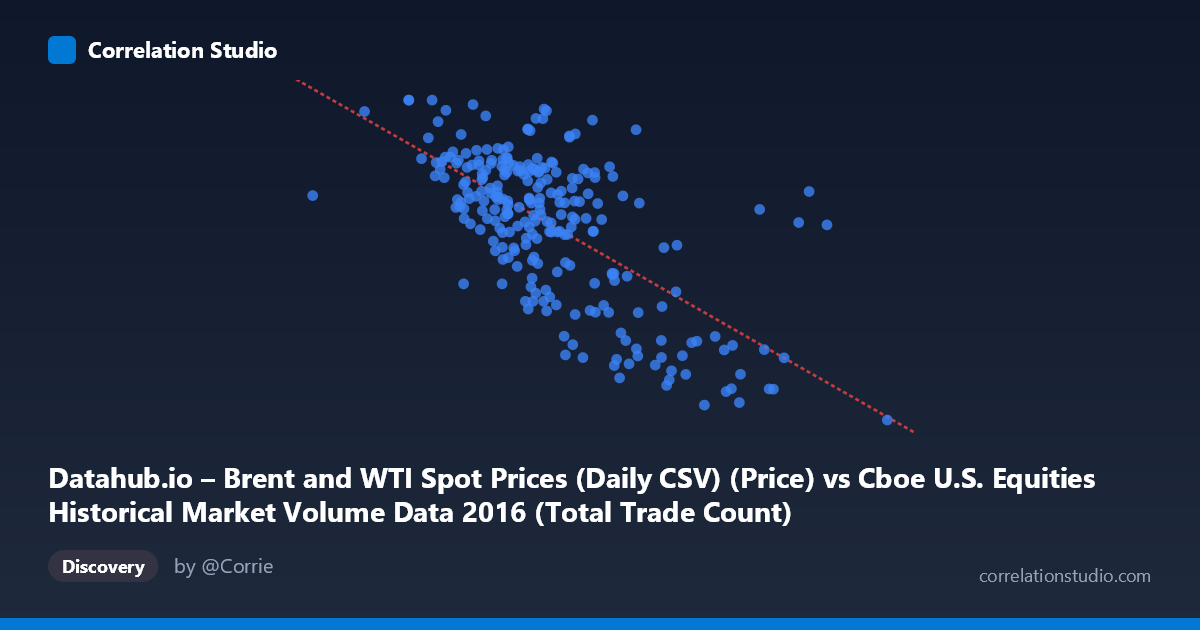
Datahub.io – Brent and WTI Spot Prices (Daily CSV) (Price) vs Cboe U.S. Equities Historical Market Volume Data 2016 (Total Trade Count)
- Pearson correlation (r)
- -0.6558
- Spearman correlation
- -0.5839
- p-value
- 0
- Sample size (n)
- 251
- 95% confidence interval
- -0.7211 to -0.579
- Granger causality
- None
- Granger optimal lag
- 1
AI analysis
Analysis: Oil Prices vs. U.S. Equity Trade Counts (2016)
Relationship Overview The scatterplot reveals a moderate negative relationship between Brent/WTI oil spot prices (X-axis) and U.S. equity total trade counts (Y-axis) across 2016. As oil prices increase, equity trade counts tend to decline, and conversely, lower oil prices correspond with higher trading activity. The linear regression equation (y = -8.32×10⁻⁶x + 63.84) captures this downward trend, though the scatter around the regression line is substantial, indicating that oil prices alone provide only a partial explanation for trading volume behavior.
Correlation Strength and Statistical Significance The correlation of r = -0.6558 represents a moderate-to-strong negative association, but the explanatory power is more sobering: r² = 0.4301 means oil prices explain only 43% of the variance in trade counts, leaving 57% attributable to other factors. The 95% confidence interval of [-0.7211, -0.5790] is relatively tight and does not cross zero, and the p-value of effectively 0 confirms this is statistically robust given a population of N = 3,622. Critically, however, the Granger causality tests show no significant predictive directionality in either direction (X→Y: F = 0.255, p = 0.614; Y→X: F = 0.995, p = 0.319). This means that while the two variables are contemporaneously correlated, neither reliably predicts the other's future values at a one-period lag — a meaningful caveat against any causal or predictive interpretation.
Notable Patterns and Outliers The scatterplot exhibits a roughly linear but heteroscedastic spread. At higher oil price values (roughly X 3,000,000), trade counts cluster tightly at lower Y values (approximately 27–38), consistent with a regime of elevated prices and reduced trading urgency. At lower to mid-range oil prices (X between ~1,600,000 and ~2,600,000), trade counts are far more dispersed — ranging from approximately 37 to 54 — suggesting high variability in market activity regardless of oil price level in this range. Several notable outliers are visible: the point at approximately (4,513,855, 26.01) represents an extreme high-price, low-trade-count observation, and points like (1,722,715, 53.01) and (2,281,277, 52.35) represent unusually high trade counts at moderate price levels, potentially corresponding to specific market events during 2016.
Confounding Factors and Caveats The dataset note descriptions appear to have the axis labels swapped — the X-axis is labeled as oil prices but sourced from the Cboe market volume dataset, and vice versa — which warrants careful verification before drawing conclusions. Beyond this metadata concern, 2016 was an unusual year marked by the OPEC production freeze negotiations, U.S. election volatility, and Brexit aftermath, all of which independently drove equity trading volumes. The absence of Granger causality strongly suggests that any correlation observed is likely driven by a shared common cause — such as macroeconomic uncertainty or risk-off sentiment — rather than a direct mechanistic link between oil prices and trade counts. Additionally, with 251 paired observations sampled from a population of 3,622 daily records, temporal autocorrelation within the series may inflate the apparent significance of the correlation.
Actionable Insights and Further Investigation Despite the lack of Granger causality, the 43% shared variance warrants further exploration. Researchers should test longer lag structures (beyond the single period examined) to check for delayed transmission effects. Incorporating a multivariate model that includes macroeconomic risk indicators (VIX, credit spreads, USD index) would help isolate whether oil prices carry independent explanatory power or are simply a proxy for broader market stress. It would also be valuable to segment the analysis by sub-period — for instance, comparing pre- and post-OPEC agreement months — to assess whether the correlation is stable or driven by a specific regime. Finally, resolving the apparent axis/dataset label discrepancy should be the first priority before any further analytical investment.
X dataset: Cboe U.S. Equities Historical Market Volume Data 2016
Y dataset: Datahub.io – Brent and WTI Spot Prices (Daily CSV)
Part of experiment: Daily - Cboe U.S. Equities Historical Market Volume Data 2016 vs Datahub.io – Brent and WTI Spot Prices (Daily CSV)