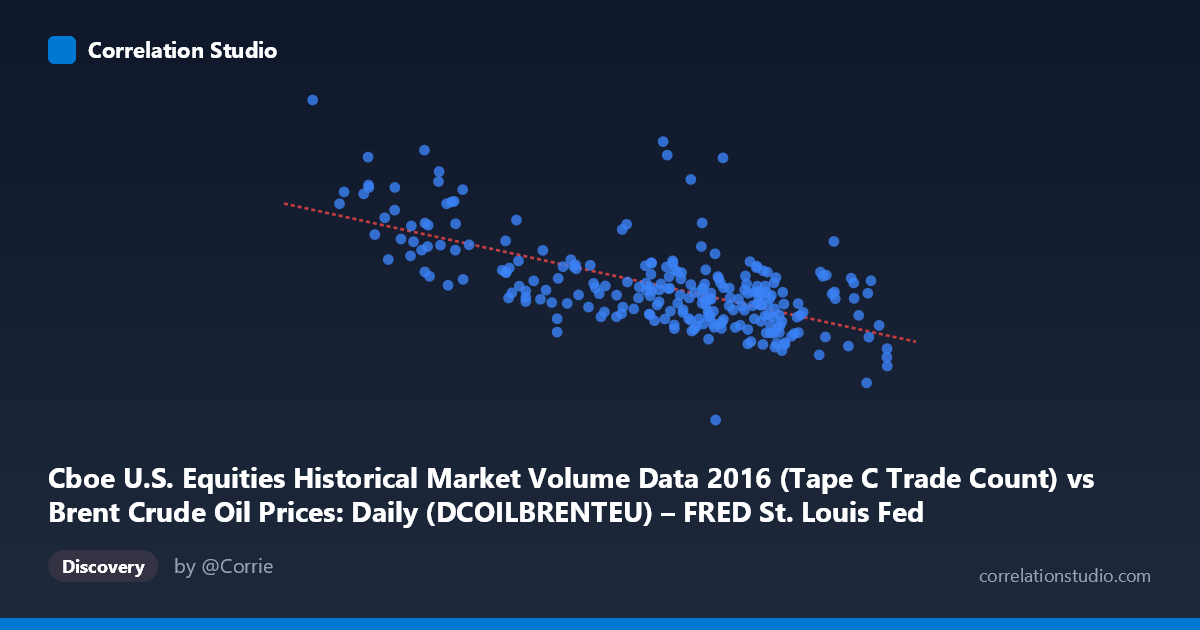
Cboe U.S. Equities Historical Market Volume Data 2016 (Tape C Trade Count) vs Brent Crude Oil Prices: Daily (DCOILBRENTEU) – FRED St. Louis Fed (DCOILBRENTEU)
- Pearson correlation (r)
- -0.6498
- Spearman correlation
- -0.5868
- p-value
- 0
- Sample size (n)
- 251
- 95% confidence interval
- -0.716 to -0.572
- Granger causality
- None
- Granger optimal lag
- 10
AI analysis
Analysis: Brent Crude Oil Price vs. U.S. Equity Trade Count (2016)
Relationship Overview
The scatterplot reveals a moderate-to-strong negative relationship between Brent Crude Oil prices (X-axis, in USD/barrel) and Cboe U.S. equity trade counts (Y-axis). As crude oil prices rise, equity trade counts tend to decline, and conversely, lower oil prices are associated with higher trading volumes. The linear regression equation (y = -14,174.5x + 1,333,320) quantifies this inverse slope: each additional dollar per barrel in Brent crude is associated with approximately 14,175 fewer trades on U.S. equity exchanges. Visually, the data points form a discernible downward-sloping cloud, particularly pronounced at the extremes — the highest trade counts cluster around the lowest oil price values (near $26–32/barrel), while the lowest trade counts appear at higher price levels ($49–54/barrel).
Correlation Strength, Uncertainty, and Causality
The Pearson correlation of r = -0.6498 indicates a moderately strong negative association, and the R² of 0.4222 means that approximately 42.2% of the variance in trade count is statistically explained by oil price movements — a meaningful but incomplete picture, leaving ~58% of variance attributable to other factors. The 95% confidence interval of [-0.716, -0.572] is relatively narrow and sits entirely in negative territory, lending strong statistical confidence to the direction and approximate magnitude of this relationship. The p-value of effectively zero (given N = 3,622) confirms this is not a chance finding at any conventional significance threshold. However, the Granger causality results are notably absent in both directions — neither X→Y (F = 0.556, p = 0.849) nor Y→X (F = 0.560, p = 0.845) achieves significance at the optimal 10-period lag. This is a critical finding: while the two variables are meaningfully correlated contemporaneously, neither time-series predicts the other's future values, meaning this relationship lacks temporal predictive utility and should not be interpreted as causal.
Notable Patterns, Clusters, and Outliers
Several structural features stand out in the data. There is a pronounced high-leverage cluster at the low end of the oil price range (approximately $26–34/barrel) where trade counts spike dramatically — values reaching 850,000 to over 1,300,000 — well above the central mass of the distribution. These likely correspond to early 2016 market conditions, when Brent crude bottomed out near historic lows, triggering exceptional volatility and elevated trading activity. The point at (26.01, 1,323,308) is a clear outlier that exerts substantial influence on the regression slope. By contrast, the bulk of observations cluster in the $40–54 range with trade counts between roughly 500,000–800,000, forming a tighter but still dispersed cloud. There is also visible heteroscedasticity: variance in trade counts is substantially wider at lower oil prices than at higher ones, suggesting the linear model's assumptions may be partially violated at the extremes.
Confounding Factors and Interpretive Caveats
This correlation is almost certainly spurious or heavily confounded by shared temporal dynamics rather than a direct economic mechanism. Both variables are time-indexed to 2016, and the early-year period saw simultaneously low oil prices and a global equity market selloff/volatility event — conditions that independently drive higher trading volumes through fear-driven activity. Volatility (VIX), macroeconomic sentiment, and calendar effects (e.g., January effect, quarterly rebalancing) likely explain much of the co-movement. The dataset mixes two fundamentally different domains — a commodity benchmark and an equity microstructure metric — whose connection is mediated through complex, multi-step transmission mechanisms rather than direct causation. The axis label mismatch in the metadata (X described as trade count data but labeled with crude prices, and vice versa) warrants careful verification of which variable is truly on which axis before drawing firm conclusions.
Actionable Insights and Further Investigation
Given the absence of Granger causality, practitioners should not attempt to use oil price movements to forecast near-term equity trading volume (or vice versa) with any predictive reliability at a 10-day horizon. The relationship appears to be a coincidence of 2016-specific market conditions rather than a robust structural link. Further investigation should: (1) control for the VIX or realized volatility to decompose how much of the trade count variation is driven by fear/uncertainty rather than oil prices directly; (2) test sub-period stability by breaking the year into quarters to see whether the correlation holds outside the January–February stress period; (3) apply robust regression or exclude high-leverage outliers (the $26–34/barrel cluster) to assess sensitivity; and (4) explore whether sector-specific trade counts (energy stocks in particular) show a stronger or more causally interpretable link to oil prices than aggregate market volume does.
X dataset: Brent Crude Oil Prices: Daily (DCOILBRENTEU) – FRED St. Louis Fed
Y dataset: Cboe U.S. Equities Historical Market Volume Data 2016
Part of experiment: Daily - Brent Crude Oil Prices: Daily (DCOILBRENTEU) – FRED St. Louis Fed vs Cboe U.S. Equities Historical Market Volume Data 2016