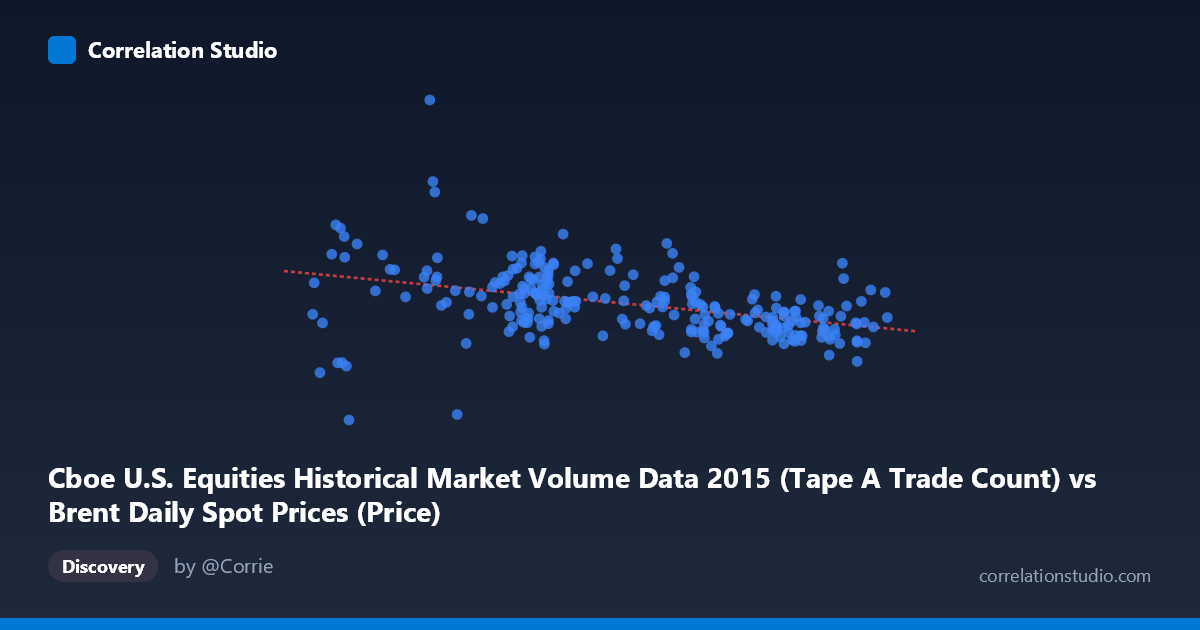
Cboe U.S. Equities Historical Market Volume Data 2015 (Tape A Trade Count) vs Brent Daily Spot Prices (Price)
- Pearson correlation (r)
- -0.4039
- Spearman correlation
- -0.4814
- p-value
- 0
- Sample size (n)
- 251
- 95% confidence interval
- -0.5026 to -0.2948
- Granger causality
- None
- Granger optimal lag
- 10
AI analysis
Analysis: Brent Crude Oil Prices vs. Cboe U.S. Equities Trade Count (2015)
Relationship Overview The scatterplot reveals a moderate negative relationship between Cboe U.S. equities trade count (Tape A) and Brent crude oil spot prices across 2015. As equity trade counts increase, oil prices tend to decline. The linear regression equation (y = -12,919.1x + 2,104,170) quantifies this: each additional unit increase in trade count is associated with approximately a $12,919 decrease in the Brent price index value. Visually, the data points form a loosely downward-sloping cloud, suggesting the relationship exists but is far from deterministic, with considerable scatter around the regression line throughout the observed range.
Correlation Strength and Statistical Significance The Pearson correlation of r = -0.404 indicates a moderate negative association, but the explanatory power is modest: R² = 0.163, meaning trade count explains only about 16.3% of the variance in Brent crude prices — leaving roughly 84% attributable to other factors. The 95% confidence interval of [-0.503, -0.295] is entirely negative and does not cross zero, confirming the direction is reliable. With a p-value of 2.89 × 10⁻¹¹ against a sample of n = 251 drawn from a population of 3,302, this result is highly statistically significant and unlikely to be a chance artifact. However, Granger causality tests reveal no significant predictive directionality in either direction (X→Y: F = 0.565, p = 0.841; Y→X: F = 0.323, p = 0.975), meaning that knowing past values of trade count does not improve forecasts of oil prices, and vice versa. This is a critical nuance — statistical correlation exists, but neither variable temporally "leads" the other, undermining any causal or predictive trading interpretation.
Notable Patterns, Clusters, and Outliers Several features stand out in the data distribution. The bulk of observations cluster in the trade count range of 44–55 (X-axis units) and Brent prices between roughly 1,200,000–1,800,000, forming a dense central mass. However, there is a notable cluster of high-X, low-Y points (trade counts ~60–66, prices ~1,000,000–1,250,000) that appear to drive much of the negative correlation — these may correspond to periods of elevated market activity coinciding with the significant oil price decline of late 2014–2015. Conversely, a few low-X, high-Y outliers are visible, including points near (41.86, 2,247,816) and (43.84, 2,076,907), suggesting that at lower trade volumes, oil prices were occasionally very elevated. These extreme values, while influential, appear to represent real market conditions rather than data errors.
Confounding Factors and Caveats Several important caveats limit causal interpretation. First, 2015 was an extraordinary year for both markets: Brent crude experienced a dramatic secular decline driven by OPEC supply decisions and global demand concerns, while U.S. equity volatility and volume were shaped by unrelated macroeconomic events (Federal Reserve rate expectations, China slowdown fears). Both variables may be jointly driven by broader risk-off/risk-on sentiment — a classic confounding mechanism. Second, the dataset labeling appears inverted (X-axis column sourced from a "Brent Daily Spot Prices" dataset, Y-axis from "Cboe Market Volume" data), which warrants verification before drawing any conclusions. Third, the correlation may be spurious and time-driven: both series likely have strong temporal trends in 2015, and the observed correlation could largely reflect shared trending behavior rather than a genuine structural relationship. Granger causality's null results further reinforce skepticism about any mechanistic link.
Actionable Insights and Further Investigation Given the moderate correlation without temporal predictive power, practitioners should avoid using equity trade counts as a leading indicator for oil price movements. Instead, several follow-up analyses are warranted: (1) Detrend both series to remove shared temporal drift and retest correlation to assess whether the relationship persists after removing 2015's secular oil price decline. (2) Introduce mediating variables such as VIX (volatility index), USD index, or S&P 500 returns to test whether the correlation is absorbed by a common driver. (3) Segment the year by quarter — the high-trade-count/low-price cluster suggests the relationship may be period-specific (e.g., Q3–Q4 2015), and sub-period analysis could reveal structural breaks. (4) Verify the dataset column assignments to ensure variables are correctly attributed. A cleaner causal framework, potentially using structural VAR models or instrument variables, would be needed before any investment or policy conclusions are drawn from this association.
X dataset: Brent Daily Spot Prices
Y dataset: Cboe U.S. Equities Historical Market Volume Data 2015
Part of experiment: Daily - Brent Daily Spot Prices vs Cboe U.S. Equities Historical Market Volume Data 2015