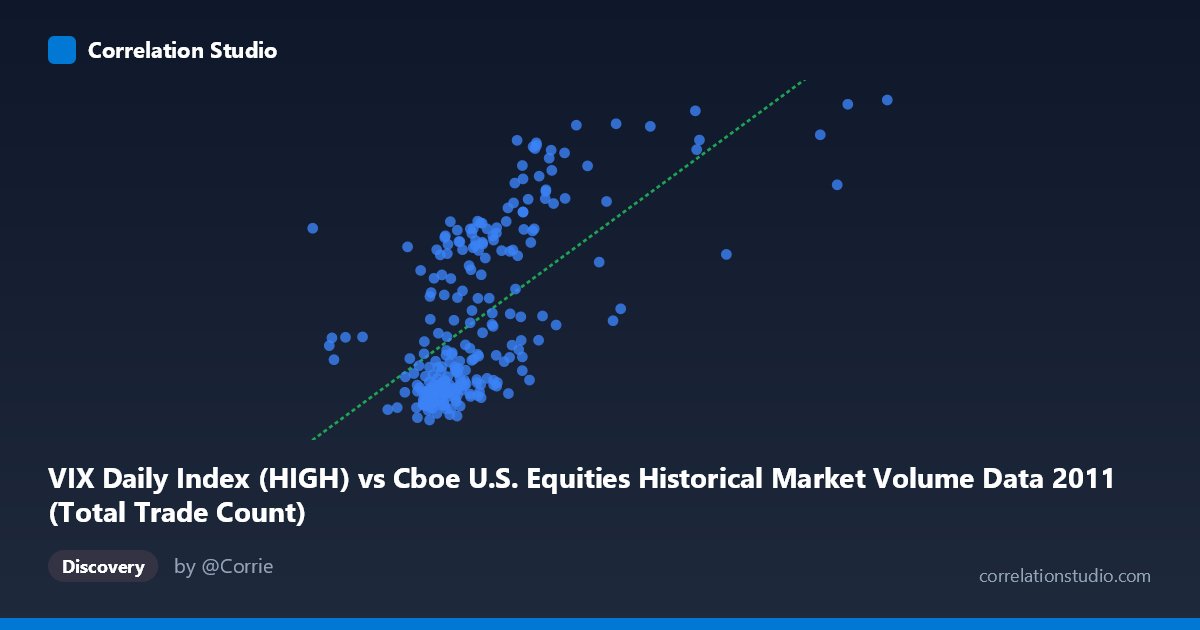
VIX Daily Index (HIGH) vs Cboe U.S. Equities Historical Market Volume Data 2011 (Total Trade Count)
- Pearson correlation (r)
- 0.6395
- Spearman correlation
- 0.6542
- p-value
- 0
- Sample size (n)
- 252
- 95% confidence interval
- 0.5602 to 0.7072
- Granger causality
- None
- Granger optimal lag
- 1
- Time coverage
- 2011-01-03 to 2011-12-30
- Recomputed on refreshed data
- 2026-10-09 (r was 0.6395)
AI analysis
Analysis: VIX Daily Index (HIGH) vs. Total Trade Count (2011)
Relationship Overview The scatterplot reveals a moderate positive relationship between the VIX Daily Index High values and the Total Trade Count for U.S. equities in 2011. As VIX High readings increase, trade counts tend to rise, which aligns intuitively with market microstructure theory: elevated volatility typically drives heightened trading activity as market participants react to uncertainty, rebalance portfolios, and execute hedging strategies. The linear regression equation (y = 1.048×10⁻⁵x + 4.178) confirms this upward slope, though the substantial scatter around the regression line signals that the relationship is far from deterministic.
Correlation Strength and Statistical Framing The correlation of r = 0.64 indicates a moderate positive association, but the r² of 0.409 is the more sobering metric — only 40.9% of the variance in trade count is explained by VIX High levels, meaning nearly 60% of trading volume variability is driven by other factors entirely. The 95% confidence interval of [0.56, 0.71] is meaningfully narrow given the sample size of n = 252 drawn from a population of 3,780 observations, and the p-value of effectively zero confirms this correlation is not a statistical artifact. However, the Granger causality results tell a critical story: neither direction (X→Y: F = 0.28, p = 0.60; Y→X: F = 0.10, p = 0.75) achieves significance, meaning that VIX High does not temporally predict trade counts, nor do trade counts predict VIX levels at a one-period lag. The contemporaneous correlation is real, but neither variable leads the other in a predictive sense.
Notable Patterns, Clusters, and Outliers The scatterplot exhibits several distinctive structural features. A dense cluster of points congregates in the lower-left region (VIX High roughly 835K–2M, trade counts ~15–25), representing the more typical low-volatility, moderate-activity trading days. Above VIX High levels of approximately 2.5M, the data becomes notably more dispersed, with trade counts ranging widely from roughly 24 to 48 — suggesting that high-volatility environments produce highly variable trading responses rather than a uniform surge. Several apparent outliers exist in the upper-right quadrant (e.g., points near X = 3.6M, Y = 42.9 and X = 4.98M range), which likely correspond to specific market stress events in 2011 such as the U.S. debt ceiling crisis and European sovereign debt turbulence in August–September. These extreme observations may be exerting disproportionate influence on the regression slope.
Confounding Factors and Caveats Several important caveats temper interpretation. First, 2011 was an unusually volatile year marked by discrete macroeconomic shocks (U.S. credit downgrade, Eurozone crisis, Japanese earthquake), meaning the correlation observed may reflect shared responses to common external catalysts rather than a structural VIX-to-volume relationship. Both variables may be jointly driven by third factors such as news flow intensity, Federal Reserve announcements, or cross-asset contagion — classic omitted variable confounding. Second, the axis labels appear to be swapped in the dataset metadata (VIX data is listed under the market volume dataset and vice versa), which warrants verification before drawing firm conclusions. Third, the linear model may be misspecified — the fan-shaped dispersion at higher X values suggests potential heteroskedasticity, and a log-linear or piecewise model might better capture the true relationship.
Actionable Insights and Further Investigation Practitioners monitoring market liquidity conditions should treat VIX levels as a rough contemporaneous signal of elevated trading activity, but should not rely on it as a leading predictor given the absent Granger causality. Further investigation should include: (1) testing non-linear specifications (log-log or threshold regression) to better capture the relationship at extreme VIX levels; (2) segmenting the data by identified market stress episodes to assess whether the correlation strengthens during crisis periods specifically; (3) incorporating intraday data to assess whether the VIX-volume relationship manifests within the trading day rather than at daily lags; and (4) adding control variables such as S&P 500 returns, options expiration calendars, and Fed announcement days to isolate the independent contribution of VIX to trade count variability. Replicating this analysis across multiple years would also clarify whether this moderate correlation is structurally stable or a 2011-specific artifact.
X dataset: Cboe U.S. Equities Historical Market Volume Data 2011
Y dataset: VIX Daily Index
Part of experiment: Daily - Cboe U.S. Equities Historical Market Volume Data 2011 vs VIX Daily Index