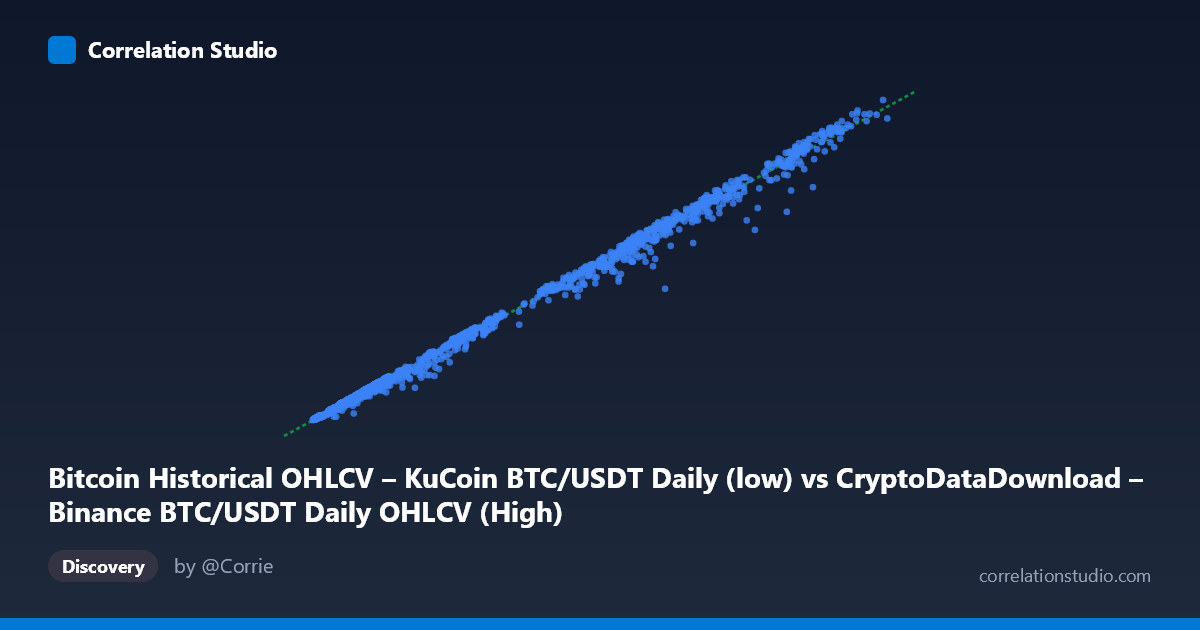
Bitcoin Historical OHLCV – KuCoin BTC/USDT Daily (low) vs CryptoDataDownload – Binance BTC/USDT Daily OHLCV (High)
- Pearson correlation (r)
- 0.9981
- Spearman correlation
- 0.9972
- p-value
- 0
- Sample size (n)
- 1861
- 95% confidence interval
- 0.9979 to 0.9983
- Granger causality
- None
- Granger optimal lag
- 10
AI analysis
Analysis: BTC/USDT Daily Low (Binance) vs. Daily High (KuCoin)
1. Overview of the Relationship
The scatterplot displays an extremely tight, near-perfect linear relationship between Binance's daily low price and KuCoin's daily high price for BTC/USDT, spanning October 2017 to November 2022. Points hug a straight line across the entire price range—from ~$3,200 to ~$69,000—with no visible curvature, fanning, or regime breaks. This is expected behavior for the same underlying asset traded on two highly liquid, arbitrage-linked exchanges.
2. Strength, Direction, and Statistical Confidence
The correlation coefficient (r = 0.9981) indicates an almost perfect positive linear relationship, and r² = 0.9962 means 99.6% of the variance in KuCoin's daily high is explained by Binance's daily low. The regression slope (0.9396) and near-zero intercept (6.27) confirm the two series move essentially in lockstep, with KuCoin's high sitting slightly below a 1:1 scaling of Binance's low (consistent with high vs. low being different intraday extremes, not identical price points). The 95% CI [0.9979, 0.9983] is razor-narrow, and p ≈ 0 confirms this relationship is not due to chance—unsurprising given N = 1,861 and the shared market driver (global BTC price).
Critically, the Granger causality test shows no significant predictive direction (p = 0.41 both ways). This means neither series' daily low reliably predicts the other's daily high beyond what's already reflected contemporaneously—the correlation is synchronous, not sequential. This makes sense: both metrics respond to the same real-time global BTC price discovery mechanism rather than one exchange leading the other with a lag.
3. Patterns, Clusters, and Outliers
The sample points reveal a clustering pattern typical of price data with exponential/skewed distribution: dense clusters at lower price levels ($3,000–$15,000, reflecting 2018–2020 bear/consolidation periods) and sparser points at higher prices ($40,000–$69,000, reflecting 2021 bull-market highs). No clear outliers are apparent—even at high price points (e.g., 32,162.59 → 27,767.10, a slightly larger low-high spread), deviations stay proportionally small. This proportional spread widening at higher price levels (heteroskedasticity) is normal for financial return-based volatility, where absolute dollar spreads grow with price magnitude even if percentage volatility stays constant.
4. Confounding Factors and Caveats
This is not an independent correlation—it's mechanically driven by the fact that BTC/USDT is fungible across exchanges via arbitrage, keeping prices tightly bound. The "low" and "high" being compared are different daily statistics (intraday minimum vs. maximum) from different platforms, so residual variance likely reflects (a) genuine cross-exchange price gaps (liquidity, regional demand, fee structures) and (b) the natural gap between a day's low and high (intraday volatility) rather than exchange-specific discrepancies. Time-series data also violates independence assumptions underlying standard r/p-value interpretation—autocorrelation in price trends inflates apparent significance, though the effect size here is genuinely robust regardless.
5. Suggested Further Investigation
Given the near-1:1 relationship, more insight would come from analyzing the residuals (KuCoin high − predicted value) as a proxy for cross-exchange spread/arbitrage opportunity, especially during high-volatility events (e.g., 2021 bull run, 2022 crashes) where slippage or exchange-specific liquidity crunches might create temporary dislocations. Examining lagged correlations at sub-daily granularity (hourly/minute) rather than daily aggregates could reveal short-term lead-lag dynamics masked by daily bucketing. Finally, comparing volume-weighted metrics or bid-ask spreads alongside price could clarify whether one exchange serves as a more reliable price-discovery leader for arbitrage/trading strategy purposes.
X dataset: CryptoDataDownload – Binance BTC/USDT Daily OHLCV
Y dataset: Bitcoin Historical OHLCV – KuCoin BTC/USDT Daily
Part of experiment: Bitcoin - CryptoDataDownload – Binance BTC/USDT Daily OHLCV vs Bitcoin Historical OHLCV – KuCoin BTC/USDT Daily