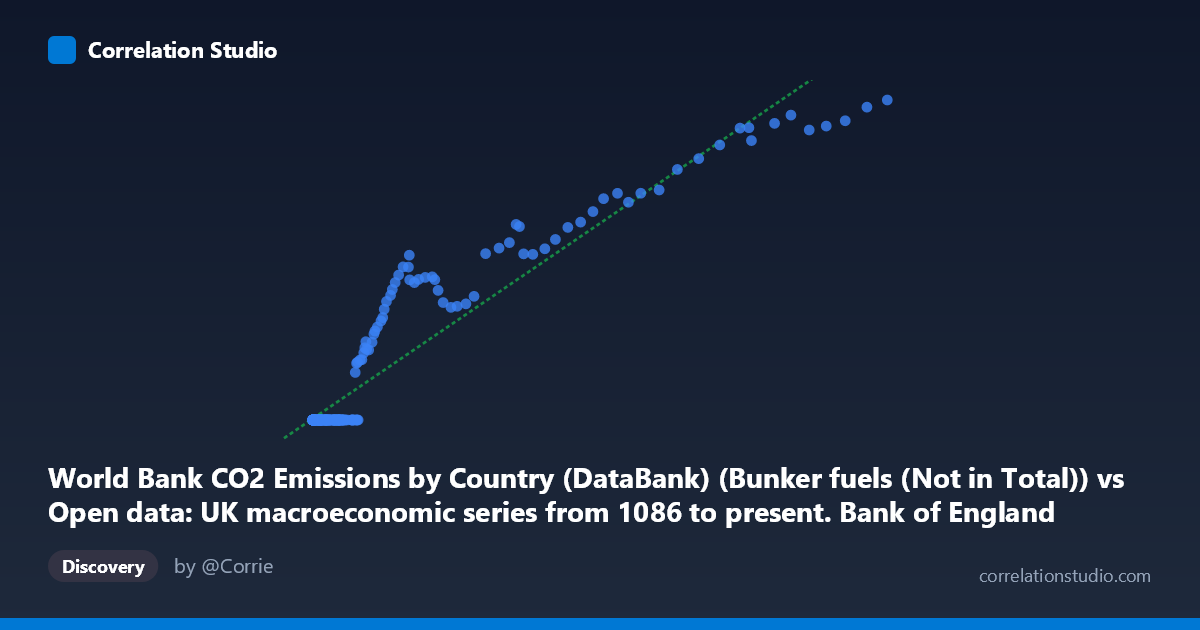
World Bank CO2 Emissions by Country (DataBank) (Bunker fuels (Not in Total)) vs Open data: UK macroeconomic series from 1086 to present. Bank of England Millennium of Macroeconomic Data. (Year) (value)
- Pearson correlation (r)
- 0.9497
- Spearman correlation
- 0.7592
- p-value
- 0
- Sample size (n)
- 266
- 95% confidence interval
- 0.9363 to 0.9603
- Granger causality
- Y → X
- Granger optimal lag
- 10
- Time coverage
- 1751-01-01 to 2016-01-01
AI analysis
Scatterplot Analysis: Bunker Fuel CO2 Emissions vs. UK Macroeconomic Indicator
1. Overall Relationship
The scatterplot reveals a strong positive relationship between World Bank CO2 emissions from bunker fuels and a UK macroeconomic variable (likely GDP, money supply, or a related economic aggregate from the Bank of England dataset). As bunker fuel emissions increase, the macroeconomic indicator rises correspondingly, following a broadly linear trajectory described by y = 0.00395x − 1.61. Notably, a substantial cluster of points sits at or near Y = 0, indicating that a meaningful portion of observations correspond to periods or conditions where the macroeconomic variable was negligible or absent — likely reflecting the pre-industrial era or early historical periods in this 1751–2016 dataset.
2. Correlation Strength and Causality
The correlation is exceptionally strong (r = 0.9497), and the R² of 0.902 means that approximately 90.2% of the variance in the macroeconomic indicator is statistically explained by bunker fuel emissions — a remarkably high figure for historical cross-domain data. The 95% confidence interval [0.9363, 0.9603] is narrow, reflecting high precision in the estimate, and the p-value of effectively zero confirms this is not a chance association across the n = 266 paired observations drawn from a population of N = 18,769. The Granger causality analysis adds an important directional nuance: Y Granger-causes X (F = 2.375, p = 0.011) at a 10-period lag, while X→Y falls just short of conventional significance (F = 1.799, p = 0.062). This suggests that the UK macroeconomic indicator has historically been a leading predictor of bunker fuel emissions — economic activity appears to precede and predict shipping/aviation fuel use, not the reverse. This is economically intuitive: trade and output drive demand for international transport fuels.
3. Patterns, Clusters, and Outliers
Several structural features stand out:
- Zero-floor cluster: A large number of points pile up along Y ≈ 0, spanning a wide range of X values (roughly 2,000–45,000 units). These likely represent early historical periods (pre-1850s) when the macroeconomic variable had not yet scaled, or periods of economic contraction/data gaps. - Linear upper band: Above the zero cluster, points follow the regression line tightly, with values extending to X ≈ 468,775 and Y ≈ 1,512, suggesting a consistent proportional relationship during the modern industrial era. - High-value observations: Points like (356,381, 1,381), (315,607, 1,235), and (298,265, 1,184) represent the upper extreme — likely late 20th or early 21st century observations — and align well with the linear fit without being severe outliers. - Moderate scatter at mid-range: Around X = 50,000–120,000, there is visible vertical dispersion, with some points near zero and others at 300–800, suggesting structural breaks or regime changes in the historical series.
4. Confounding Factors and Caveats
Several important caveats apply:
- Shared time trend: Both series exhibit strong upward temporal trends over 1751–2016. Much of the correlation may reflect common non-stationarity — both variables growing over time — rather than a direct causal mechanism. This is a classic spurious correlation risk with long historical time series. - Bunker fuels are global, not UK-specific: Bunker fuels (international shipping and aviation) are allocated globally, not to a single country. Correlating a global emissions category with a UK-specific macroeconomic indicator conflates scales. - Data density and missingness: The zero-heavy cluster may partially reflect missing or zero-imputed historical data rather than true zero values, which would artificially inflate the correlation. - Structural breaks: Wars, the Great Depression, post-war reconstruction, and oil shocks likely created nonlinear regime shifts visible in the mid-range scatter that a single linear model cannot fully capture. - Unit mismatch: The macroeconomic variable's units are unspecified ("value"), making practical interpretation of the regression slope (0.00395 per unit of CO2) ambiguous.
5. Actionable Insights and Further Investigation
- Detrend both series (e.g., first-differencing or HP filter) before re-estimating correlation to test whether the relationship survives removal of the shared time trend — if r drops sharply, the correlation is largely spurious. - Segment the analysis into pre- and post-industrialization periods (e.g., pre/post-1850) to determine whether the relationship is structurally consistent or driven entirely by the modern era. - Identify the Y variable precisely: Confirming whether it is nominal GDP, real GDP, money supply, or another aggregate would clarify whether the Granger result reflects trade-driven economic activity or a monetary/financial channel. - Extend Granger testing with cointegration analysis (Engle-Granger or Johansen) to determine whether the two series share a long-run equilibrium relationship, which would provide stronger causal footing than correlation alone. - Incorporate other predictors (UK trade volumes, global shipping indices) to test whether bunker fuel emissions mediate the link between UK economic output and global transport demand, which the Granger directionality hint suggests is plausible.
X dataset: Open data: UK macroeconomic series from 1086 to present. Bank of England Millennium of Macroeconomic Data. (Year)
Y dataset: World Bank CO2 Emissions by Country (DataBank)
Part of experiment: Yearly - Open data: UK macroeconomic series from 1086 to present. Bank of England Millennium of Macroeconomic Data. (Year) vs World Bank CO2 Emissions by Country (DataBank)