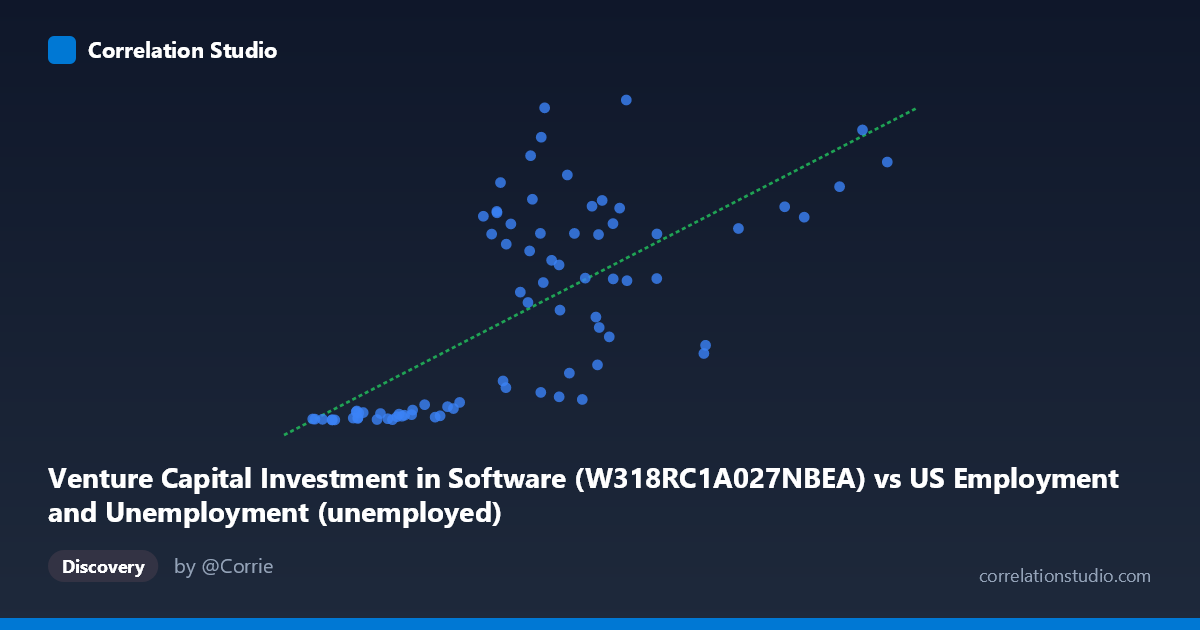
Venture Capital Investment in Software (W318RC1A027NBEA) vs US Employment and Unemployment (unemployed)
- Pearson correlation (r)
- 0.6945
- Spearman correlation
- 0.7518
- p-value
- 0
- Sample size (n)
- 79
- 95% confidence interval
- 0.5593 to 0.7938
- Granger causality
- None
- Granger optimal lag
- 10
- Time coverage
- 1946-01-01 to 2024-01-01
AI analysis
Analysis: Venture Capital Software Investment vs. Unemployment
Overview of the Relationship
The scatterplot reveals a positive correlation between Venture Capital Investment in Software (X) and US Unemployment levels (Y) over the period 1946–2024. As software investment increases, unemployment tends to rise as well — a counterintuitive finding at first glance, given the common assumption that tech investment drives job creation and reduces unemployment. The linear regression equation (y = 0.0333x − 60.47) confirms this positive slope, suggesting that each unit increase in software VC investment is associated with a modest but measurable increase in unemployment. However, the relationship is far from deterministic, with considerable scatter visible across the full range of both variables.
Correlation Strength and Statistical Significance
The Pearson correlation of r = 0.6945 indicates a moderate-to-strong positive association, but the coefficient of determination r² = 0.4824 is the more sobering statistic — only 48.2% of the variance in unemployment is explained by software investment, leaving more than half attributable to other factors. The 95% confidence interval [0.5593, 0.7938] is reasonably tight and sits entirely above zero, and the p-value of 1.256 × 10⁻¹² confirms the relationship is highly statistically significant — this is almost certainly not a chance finding. That said, statistical significance does not imply causation or practical sufficiency. Critically, the Granger causality tests fail in both directions (X→Y: F = 0.85, p = 0.58; Y→X: F = 0.66, p = 0.75), meaning that neither variable temporally predicts the other even at an optimal lag of 10 periods. This absence of Granger causality is a strong signal that the observed correlation likely reflects shared confounding trends rather than any direct or lagged causal mechanism.
Patterns, Clusters, and Outliers
The data points form a recognizable two-regime structure. A dense lower-left cluster groups observations where software investment is low (roughly 1,800–5,000 range) and unemployment is correspondingly low (typically under 30), likely representing earlier decades (1940s–1980s) before the tech investment boom. A broader upper-right dispersion captures higher investment values (6,000–15,000) paired with highly variable unemployment figures ranging from under 50 to over 466. This upper cluster shows substantial vertical scatter, suggesting the relationship becomes noisier at higher investment levels. Several notable outliers stand out: the point at approximately (8,924; 466) is the highest unemployment observation; (7,078; 455) and (6,761; 385) are also high-Y outliers relative to their X values. Conversely, points like (7,929; 31) and (7,406; 35) show high investment paired with surprisingly low unemployment, suggesting context-specific conditions (possibly favorable economic cycles) that suppress unemployment despite elevated investment levels.
Confounding Factors and Interpretive Caveats
The most significant interpretive concern here is spurious correlation driven by shared secular trends. Both VC software investment and raw unemployment counts tend to grow over time as the US economy and population expand — meaning much of the observed correlation may simply reflect two upward-trending time series occupying the same historical window, not a meaningful economic link. The use of raw unemployment counts (rather than the unemployment rate) amplifies this issue, since a larger labor force mechanically produces higher absolute unemployment even at low rates. Additionally, economic crises (the 2001 dot-com bust, the 2008–2009 financial crisis, COVID-19 in 2020) may simultaneously spike unemployment and suppress VC investment in complex, non-linear ways that distort the overall correlation. The 10-period optimal lag in the Granger test also suggests the data structure may not be well-suited to standard temporal causality frameworks, and the dataset's annual resolution may obscure important within-year dynamics.
Actionable Insights and Further Investigation
Researchers and analysts should avoid interpreting this correlation as evidence that software investment causes unemployment — the Granger causality failure alone should give strong pause. More informative next steps would include: (1) detrending both series (e.g., first-differencing or using unemployment rate rather than count) to remove shared time trends and test whether the correlation persists; (2) controlling for GDP, population growth, and business cycle indicators in a multivariate regression to isolate any independent contribution of software investment; (3) examining sector-specific employment data in tech and software to test whether investment correlates with tech employment gains even if aggregate unemployment moves differently; and (4) applying structural break analysis around key periods (1995 dot-com era, 2008 crisis, 2020 pandemic) to assess whether the relationship is stable across time or regime-dependent. The moderately high r² is intriguing enough to warrant deeper analysis, but should not be acted upon in policy or investment contexts without substantially richer modeling.
X dataset: US Employment and Unemployment
Y dataset: Venture Capital Investment in Software
Part of experiment: Yearly - US Employment and Unemployment vs Venture Capital Investment in Software