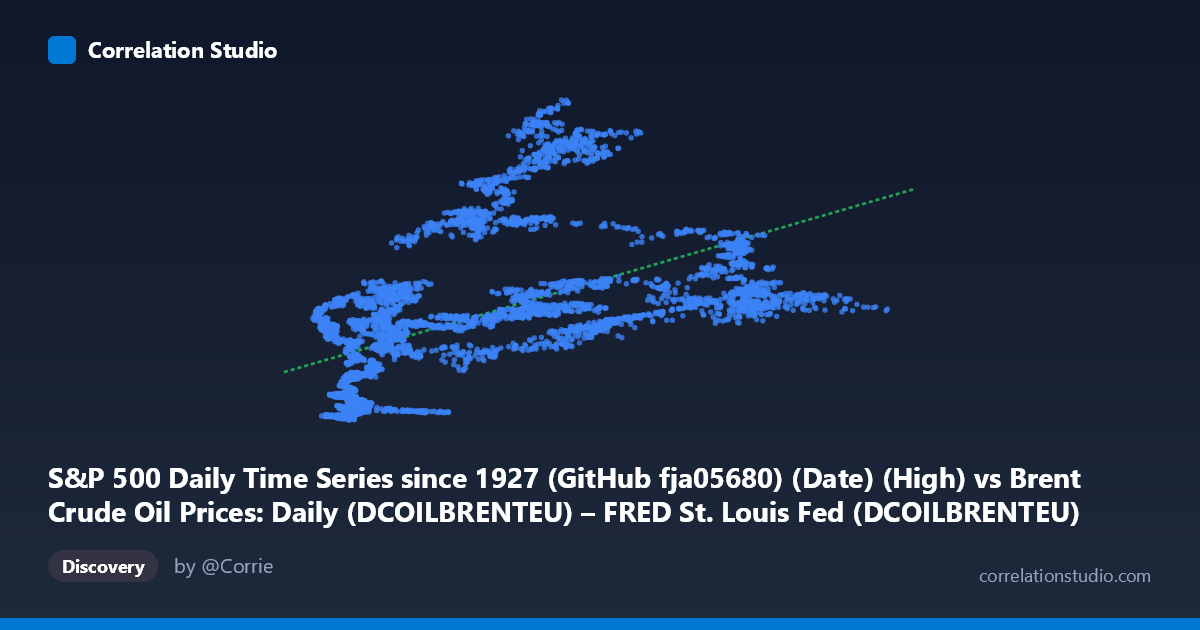
S&P 500 Daily Time Series since 1927 (GitHub fja05680) (Date) (High) vs Brent Crude Oil Prices: Daily (DCOILBRENTEU) – FRED St. Louis Fed (DCOILBRENTEU)
- Pearson correlation (r)
- 0.5381
- Spearman correlation
- 0.6914
- p-value
- 0
- Sample size (n)
- 8140
- 95% confidence interval
- 0.5225 to 0.5534
- Granger causality
- None
- Granger optimal lag
- 1
AI analysis
Analysis: S&P 500 Daily High vs. Brent Crude Oil Price
1. Overall Relationship Revealed
The scatterplot reveals a positive but highly dispersed relationship between the S&P 500 daily high price and Brent Crude Oil prices across a 32-year period (1987–2019). While the general trend line slopes upward (y = 11.57x + 655.14), the scatter is substantial — points fan out widely across the entire X range, indicating that knowing one variable provides only limited predictive power for the other. The distribution of sample points reinforces this: similar S&P 500 levels (e.g., ~16–20) correspond to Y values ranging from ~247 to ~1323, a more than fivefold spread. This visual dispersion immediately signals that the linear model, while statistically significant, is far from a complete description of the relationship.
2. Correlation Strength, Direction, and Causality
The Pearson r of 0.538 indicates a moderate positive correlation — both assets have trended upward over the same multi-decade period. However, the R² of 0.29 is the critical reality check: only ~29% of the variance in Brent Crude prices is explained by S&P 500 levels, leaving 71% attributable to other forces entirely. The 95% confidence interval [0.522, 0.553] is narrow given n = 8,140, confirming the estimate is precise and the p-value of effectively zero confirms statistical significance — but statistical significance here is a product of massive sample size, not necessarily economic meaningfulness. Most importantly, the Granger causality results are unambiguous: neither variable significantly predicts the other at a 1-period lag (X→Y: F = 0.91, p = 0.341; Y→X: F = 0.90, p = 0.343). This means the correlation, while real, carries no demonstrated temporal predictive directionality — neither series reliably leads the other, severely limiting any trading or forecasting application of this relationship alone.
3. Notable Patterns, Clusters, and Non-Linear Features
Several structural features stand out in the data. There is a notable cluster of low-X, low-Y points (S&P 500 highs below ~30, Brent prices below ~500), likely corresponding to the pre-2000 era when both assets were at lower nominal levels. A second, more diffuse cluster emerges at higher X values (60–110+) with Y spanning ~900–3,200, suggesting heteroscedasticity — variance in Brent prices expands substantially as S&P levels rise. The Spearman ρ exceeding Pearson r is a meaningful diagnostic flag: the monotonic rank relationship is stronger than the linear one, pointing toward a curved (logarithmic or polynomial) underlying structure. Several apparent outliers exist at high X values with relatively low Y (e.g., ~110, 1294), possibly corresponding to periods like 2014–2016 when equity markets were elevated while Brent crude collapsed due to supply shocks.
4. Confounding Factors and Interpretive Caveats
The dominant confounding factor here is shared secular time trend: both the S&P 500 and Brent Crude have trended upward over 1987–2019 largely due to inflation, economic growth, and dollar depreciation — creating a spurious correlation that is more about the passage of time than any direct economic linkage. Regime changes further complicate interpretation: the oil-equity relationship has been demonstrably unstable, shifting from negative (pre-2000s, when oil shocks hurt equities) to positive (post-2000s, when both were driven by global demand cycles and risk appetite). The use of nominal prices rather than inflation-adjusted values amplifies the time-trend artifact. Additionally, matching daily observations across two independently sourced datasets introduces potential date-alignment and look-ahead bias risks, and the mismatch between population (N = 10,174) and paired sample (n = 8,140) suggests ~20% data attrition from non-overlapping trading days, which could skew results if missing data is non-random.
5. Actionable Insights and Further Investigation
Given the moderate correlation, non-linear signal, and absent Granger causality, the most productive next steps would be: (a) detrend both series (using log-differencing or returns rather than price levels) before re-computing correlation — this would strip out the shared time trend and reveal the true contemporaneous relationship; (b) fit a polynomial or logarithmic regression to address the Spearman Pearson divergence and likely improve explanatory power; (c) segment the analysis by economic regime (e.g., pre/post-2008 financial crisis, OPEC supply shock periods) to test whether the correlation is stable or regime-dependent; and (d) incorporate lagged variables beyond 1 period in the Granger framework, as commodity-equity linkages sometimes operate over weeks rather than single trading days. Finally, including macroeconomic controls — the USD index, global GDP growth proxies, or VIX — would help isolate whether the observed correlation is a genuine oil-equity channel or an artifact of shared macro drivers.
X dataset: Brent Crude Oil Prices: Daily (DCOILBRENTEU) – FRED St. Louis Fed
Y dataset: S&P 500 Daily Time Series since 1927 (GitHub fja05680) (Date)
Part of experiment: Daily - Brent Crude Oil Prices: Daily (DCOILBRENTEU) – FRED St. Louis Fed vs S&P 500 Daily Time Series since 1927 (GitHub fja05680) (Date)