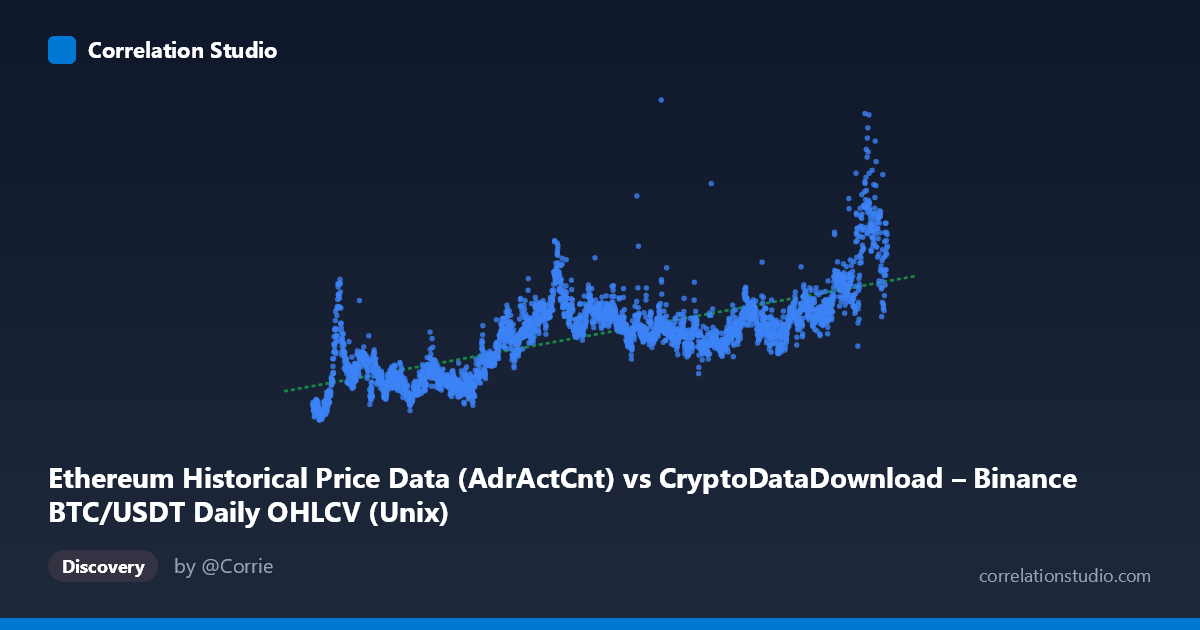
Ethereum Historical Price Data (AdrActCnt) vs CryptoDataDownload – Binance BTC/USDT Daily OHLCV (Unix)
- Pearson correlation (r)
- 0.7232
- Spearman correlation
- 0.7196
- p-value
- 0
- Sample size (n)
- 3191
- 95% confidence interval
- 0.7062 to 0.7393
- Granger causality
- None
- Granger optimal lag
- 10
AI analysis
Analysis of BTC/USDT vs. Ethereum Network/Price Metrics Correlation
1. What the Visualization Reveals
The scatterplot depicts a moderate-to-strong positive relationship between a time-indexed variable (X, spanning ~2017–2026 as Unix timestamps) and a metric ranging from roughly 131,000 to 1.5 million (Y). Because X is effectively a time axis, this plot is really showing how Y has trended upward over the nearly nine-year observation window, rather than a relationship between two independent market variables in the traditional sense. The data show substantial scatter around the regression line, with Y values clustering in the 300,000–650,000 range for much of the timeline before expanding into a wider band (600,000–1,500,000) in the most recent period (2024–2026).
2. Strength, Direction, and Predictive Relationship
The correlation coefficient (r = 0.7232) indicates a moderately strong positive linear relationship, with r² = 0.523 meaning that only about 52% of the variance in Y is explained by X (or equivalently, by time/trend). This leaves nearly half the variance attributable to other factors, noise, or non-linear dynamics not captured by the linear fit. The 95% confidence interval [0.706, 0.739] is tight, and the p-value of ~0 confirms this correlation is highly statistically significant and not a product of chance, aided by the large sample size (n = 3,191). However, statistical significance should not be conflated with practical predictive power — the Granger causality tests show no significant lead-lag relationship in either direction (X→Y: p = 0.233; Y→X: p = 0.319). This is a critical finding: despite the contemporaneous correlation, neither variable's past values help forecast the other's future values beyond what each series' own history provides. This suggests the correlation is likely driven by a shared underlying trend (e.g., both series trending upward over time, possibly due to overall crypto market growth) rather than a causal or lead-lag mechanism.
3. Notable Patterns and Features
The most striking pattern in the sampled data is a regime shift: Y values before ~2022 mostly stay below 600,000, while post-2023 values frequently exceed 700,000 and reach as high as 1,505,651 (with several sample points near 900,000–1,000,000 in 2025–2026). This suggests non-stationarity — the relationship is not stable across the full time range, and a single linear fit may mask distinct sub-periods with different slopes or volatility regimes. There also appears to be considerable short-term noise/oscillation (e.g., values dipping to 442,000–500,000 amid a generally rising trend), consistent with cyclical or cyclical-adjacent crypto market behavior (bull/bear cycles). No extreme outliers are obvious, but the increasing variance at higher X values (heteroscedasticity) is a notable feature that a linear model doesn't capture well.
4. Confounding Factors and Caveats
Several caveats are essential here. First, the metadata reveals a likely labeling inconsistency: the "X-axis" is described as an Ethereum AdrActCnt (active address count) column, while its actual data values look like Unix timestamps — and the Y-axis is labeled as a Binance BTC/USDT OHLCV column but its values don't resemble price data either. This mismatch suggests the axis labels/descriptions may be swapped, mislabeled, or that this dataset merge conflated timestamp/price columns. This makes causal interpretation risky until data provenance is verified. Second, even if data are correctly matched, both BTC price/volume-derived metrics and ETH network activity metrics are known to be strongly influenced by common macro factors (crypto market cycles, regulatory news, liquidity conditions, Bitcoin halving cycles), which would produce spurious correlation without direct causality — consistent with the null Granger result. Third, daily crypto data often exhibit autocorrelation, volatility clustering, and non-stationarity, all of which violate assumptions of simple linear correlation/regression and can inflate apparent r² without indicating a stable, predictive relationship.
5. Actionable Insights and Further Investigation
Given the mismatch between the stated column semantics and the actual data ranges, the first actionable step is to verify and correct the axis/column mappings before drawing substantive market conclusions. Once verified, given the non-stationarity suspected in both series, analysts should test the relationship on differenced or log-differenced (returns-based) data rather than raw levels, which would better reveal genuine short-term co-movement and could change the Granger causality outcome (often causality only appears after removing trend/unit-root effects). Segmenting the analysis by clear market regimes (e.g., 2017–2020, 2021–2023, 2024–2026) would help identify whether the relationship's strength changes over the bull/bear cycles evident in the scatter. Finally, since Granger tests here found no predictive direction, this pairing is more useful for descriptive/trend co-movement analysis than for building a forecasting model — traders or analysts seeking predictive signals should look to other variables or higher-frequency/lagged specifications with proper stationarity transformations.
X dataset: CryptoDataDownload – Binance BTC/USDT Daily OHLCV
Y dataset: Ethereum Historical Price Data
Part of experiment: Bitcoin - CryptoDataDownload – Binance BTC/USDT Daily OHLCV vs Ethereum Historical Price Data