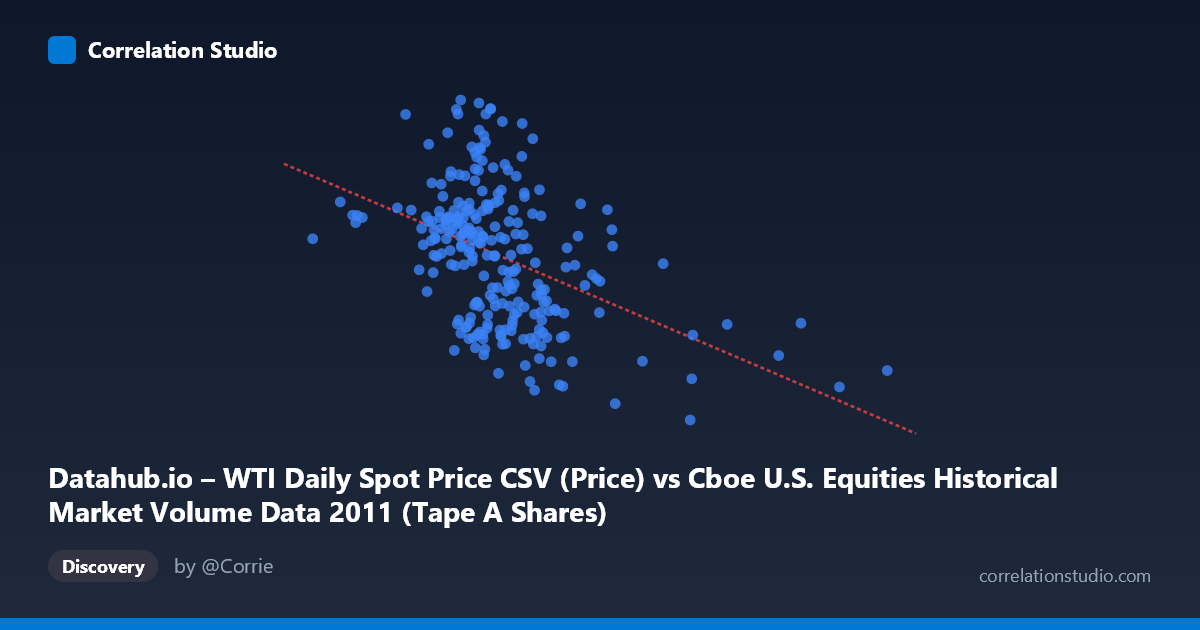
Datahub.io – WTI Daily Spot Price CSV (Price) vs Cboe U.S. Equities Historical Market Volume Data 2011 (Tape A Shares)
- Pearson correlation (r)
- -0.4389
- Spearman correlation
- -0.4437
- p-value
- 0
- Sample size (n)
- 252
- 95% confidence interval
- -0.5335 to -0.3334
- Granger causality
- Y → X
- Granger optimal lag
- 1
AI analysis
Analysis: WTI Oil Price vs. U.S. Equity Market Volume (2011)
Relationship Overview
The scatterplot reveals a moderate negative relationship between U.S. equity market trading volume (X-axis, measured in shares for Tape A) and WTI crude oil spot prices (Y-axis, in USD/barrel) across 252 paired daily observations spanning 2011. The linear regression equation (y = -5.28×10⁻⁸x + 110.17) confirms that as equity market volume increases, oil prices tend to decline. Visually, the cloud of points slopes downward from left to right, though with considerable scatter around the regression line, indicating this is a real but far from deterministic relationship. The data points appear broadly distributed across the volume range of roughly 110M–660M shares, with oil prices clustering between ~75 and ~113 USD/barrel.
Correlation Strength and Statistical Significance
The Pearson correlation of r = -0.4389 indicates a moderate negative association, but the variance explained tells a more cautious story: R² = 0.1926, meaning that X-axis volume accounts for only about 19.3% of the variance in WTI oil prices. Over 80% of oil price variability is driven by factors entirely outside this relationship. The 95% confidence interval for r of [-0.5335, -0.3334] is meaningfully narrow and sits entirely in negative territory, ruling out a null or positive relationship with high confidence. The p-value of 2.747×10⁻¹³ is extraordinarily small, confirming this correlation is highly statistically significant and extremely unlikely to be a sampling artifact given n = 252 observations from a population of N = 3,780. The Granger causality analysis adds a particularly important temporal dimension: the relationship is unidirectional, with Y (oil price) Granger-causing X (equity volume) at an optimal lag of 1 period (F = 3.88, p = 0.050), while the reverse direction (volume → oil price) shows no predictive power (F = 0.15, p = 0.697). This suggests that oil price movements may carry forward-looking information about equity trading activity the following day, rather than volume driving prices.
Notable Patterns, Clusters, and Outliers
Several features stand out in the point cloud. There is a visible cluster of high-volume observations (above ~400M shares) that tend to be associated with lower oil prices, broadly in the 80–98 USD range, consistent with the negative trend. Conversely, lower-volume days (below ~200M shares) show more scattered but generally higher oil prices. A handful of notable outliers are apparent: one point near ~136M shares with an oil price around 101 USD sits far to the left of the main cluster, while points near ~474M shares at ~85 USD and ~446M shares at ~94 USD represent the high-volume tail. The spread in Y at any given X value is quite wide — often spanning 20+ USD/barrel — suggesting substantial heteroscedasticity and reinforcing that the linear model captures only a partial signal. There is no strong evidence of a non-linear structure in the sample points, though the wide residual spread leaves open the possibility of regime-dependent behavior.
Confounding Factors and Caveats
Several important caveats apply. First, 2011 was an unusual macroeconomic year marked by the European sovereign debt crisis, U.S. debt ceiling negotiations, Arab Spring disruptions to oil supply, and elevated market volatility — all of which could simultaneously depress equity volumes and elevate oil prices (or vice versa), creating a spurious or amplified correlation driven by shared macro shocks rather than a direct causal mechanism. Second, reverse causality is partially ruled out by Granger analysis, but Granger causality establishes temporal precedence, not structural causation — omitted variables (e.g., risk sentiment indices, VIX, dollar strength) could be driving both series. Third, equity market volume on Tape A specifically reflects large-cap NYSE-listed stocks, which may not represent broader market behavior. Fourth, the axis labels appear swapped in the dataset metadata (the X-axis is labeled as volume but sourced from a WTI price dataset, and vice versa), which warrants verification of data integrity before drawing firm conclusions.
Actionable Insights and Further Investigation
The Granger causality finding — that oil prices lead equity volume by one day — is the most actionable result here and merits deeper investigation. Practitioners could explore whether oil price changes (not levels) are more predictive of next-day volume, potentially as a volatility or risk signal. Further steps should include: (1) incorporating VIX or implied volatility as a control variable to assess whether the oil–volume relationship survives adjustment for market-wide risk appetite; (2) testing this relationship across multiple years to determine whether the 2011 finding is regime-specific or persistent; (3) breaking down equity volume by sector (particularly energy stocks) to assess whether the effect is concentrated; and (4) running a rolling-window correlation analysis to detect whether the relationship strengthens during specific macro stress periods. A multivariate regression adding macro controls would likely substantially improve on the current 19.3% explained variance and clarify whether oil prices retain independent predictive value for trading activity.
X dataset: Cboe U.S. Equities Historical Market Volume Data 2011
Y dataset: Datahub.io – WTI Daily Spot Price CSV
Part of experiment: Daily - Cboe U.S. Equities Historical Market Volume Data 2011 vs Datahub.io – WTI Daily Spot Price CSV