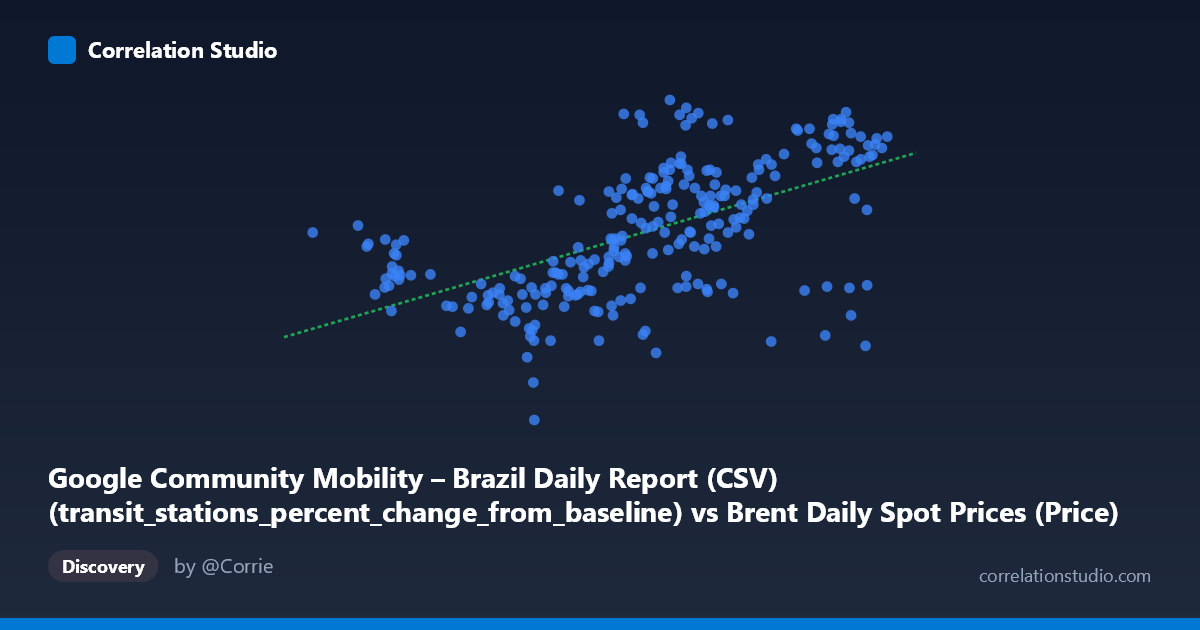
Google Community Mobility – Brazil Daily Report (CSV) (transit_stations_percent_change_from_baseline) vs Brent Daily Spot Prices (Price)
- Pearson correlation (r)
- 0.5836
- Spearman correlation
- 0.6308
- p-value
- 0
- Sample size (n)
- 253
- 95% confidence interval
- 0.496 to 0.6595
- Granger causality
- Y → X
- Granger optimal lag
- 1
AI analysis
Scatterplot Analysis: Brazil Transit Mobility vs. Brent Crude Oil Prices (2021)
Overall Relationship
The scatterplot reveals a moderate positive relationship between Google Community Mobility transit station activity in Brazil and Brent crude oil spot prices across 2021. As transit mobility increases (i.e., fewer people avoiding transit stations relative to baseline), Brent prices tend to rise as well. The linear regression equation (y = 1.809x − 87.25) indicates that for each one-percentage-point increase in transit mobility, Brent prices are associated with roughly a $1.81/barrel increase. Visually, while a positive trend is discernible, there is considerable vertical scatter at any given X value, signaling that the relationship is real but far from deterministic.
Correlation Strength and Statistical Significance
The Pearson correlation of r = 0.584 reflects a moderate positive association. However, r² = 0.341 tells the more sobering story: only 34.1% of the variance in Brent prices is explained by Brazilian transit mobility, meaning roughly two-thirds of price variation is attributable to other forces entirely. The 95% confidence interval [0.496, 0.660] is meaningfully above zero and relatively tight given n = 253, and the p-value of effectively 0 confirms this correlation is not a chance artifact. Critically, the Granger causality results invert the intuitive causal story: Y (Brent prices) Granger-causes X (transit mobility) at a 1-period lag (F = 9.03, p = 0.003), while the reverse direction fails to reach significance (F = 0.97, p = 0.326). This suggests that past oil prices carry predictive information about subsequent transit mobility in Brazil, not the other way around — plausibly because fuel cost fluctuations affect consumer and commuter behavior, or because both variables share a common economic driver where oil prices lead.
Notable Patterns, Clusters, and Outliers
Several structural features are worth noting. The data form at least two loosely separated clusters: a lower-left grouping with transit values roughly in the 50–67 range and Brent prices below ~35, and a denser upper-right cluster in the 68–85 transit / 40–91 Brent zone, suggesting possible regime shifts (e.g., COVID lockdown phases versus reopening periods in 2021). A prominent outlier at approximately (64, −31) — visible in the sample point (64.02, −31.00) — sits well below the regression line and likely corresponds to a period of severe mobility restriction. Several points in the upper range (e.g., 70.51, 85.67 and 74.12, 86.33) also pull against the regression fit. The X-axis range is relatively compressed (50–86), so apparent linearity may partly reflect limited dynamic range rather than a true linear mechanism.
Confounding Factors and Interpretive Caveats
This correlation almost certainly reflects shared temporal covariation rather than a direct causal mechanism. Both variables trended upward through 2021 as COVID-19 restrictions eased globally and economies reopened — Brazil's mobility recovered as vaccination rolled out, while Brent prices climbed from pandemic lows. This shared recovery trajectory is a classic confound: a third variable (pandemic phase / global economic reopening) likely drives both simultaneously, inflating the observed r. Additionally, the dataset metadata appears swapped in the axis labels (Brent prices are listed under the Google Mobility dataset and vice versa), which warrants verification before drawing firm conclusions. The Granger causality finding, while statistically significant, operates at a 1-day lag and may reflect news-driven sentiment or index co-movement rather than any physical or behavioral mechanism.
Actionable Insights and Further Investigation
Given the Granger result, analysts could explore whether Brent price shocks in a lagged VAR model improve short-term forecasts of Brazilian urban mobility, which could have practical relevance for transport planning and fuel subsidy policy. It would be valuable to partial out the time trend (detrend both series) to test whether the correlation persists after removing the shared pandemic-recovery signal — if r collapses near zero after detrending, the relationship is spurious. Segmenting data by Brazilian state, season, or COVID restriction phase would clarify whether the relationship is homogeneous or driven by specific subgroups. Finally, incorporating additional covariates — vaccination rates, COVID case counts, USD/BRL exchange rates — into a multivariate model would help isolate any genuine oil price–mobility channel from confounding economic dynamics.
X dataset: Brent Daily Spot Prices
Y dataset: Google Community Mobility – Brazil Daily Report (CSV)
Part of experiment: Daily - Brent Daily Spot Prices vs Google Community Mobility – Brazil Daily Report (CSV)