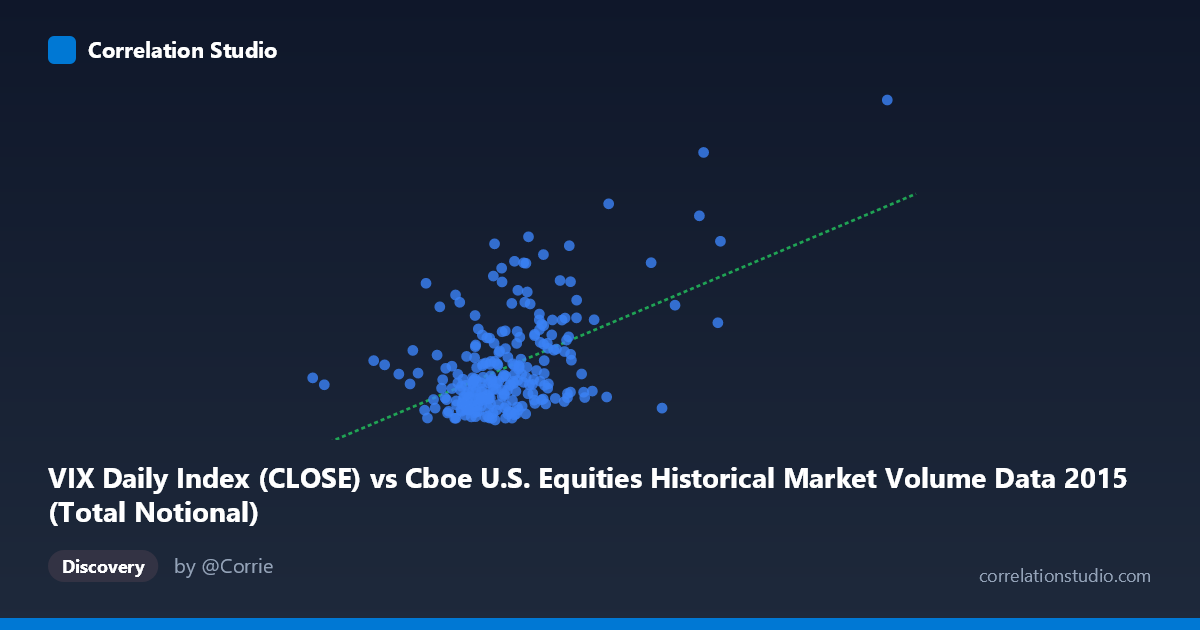
VIX Daily Index (CLOSE) vs Cboe U.S. Equities Historical Market Volume Data 2015 (Total Notional)
- Pearson correlation (r)
- 0.5151
- Spearman correlation
- 0.368
- p-value
- 0
- Sample size (n)
- 252
- 95% confidence interval
- 0.4182 to 0.6005
- Granger causality
- None
- Granger optimal lag
- 1
AI analysis
Scatterplot Analysis: VIX vs. Total Notional Volume (2015)
Relationship Overview The scatterplot reveals a moderate positive relationship between the CBOE Volatility Index (VIX) daily close values and total notional trading volume in U.S. equities markets throughout 2015. As VIX increases — indicating heightened market fear or uncertainty — total notional trading volume tends to rise as well. This is economically intuitive: periods of elevated volatility typically prompt increased trading activity as investors rebalance portfolios, hedge exposures, or respond to rapidly changing price signals. The linear regression equation (y = 5.25×10⁻¹⁰x + 5.52) confirms this positive slope, though the relationship is far from deterministic.
Correlation Strength and Statistical Significance The Pearson correlation of r = 0.5151 indicates a moderate positive association, but the more telling figure is r² = 0.2653, meaning VIX explains only about 26.5% of the variance in total notional volume. Roughly three-quarters of the variation in trading volume is driven by factors outside of VIX alone. The 95% confidence interval of [0.418, 0.601] is meaningfully above zero and relatively tight given n = 252, and the p-value of essentially 0 confirms the correlation is statistically robust — this is not a chance finding. However, statistical significance does not imply strong predictive power, and the wide scatter around the regression line underscores that VIX is a useful but incomplete predictor. Critically, Granger causality tests find no significant predictive direction in either direction (X→Y: F = 0.13, p = 0.72; Y→X: F = 0.02, p = 0.90), meaning that knowing today's VIX does not meaningfully help forecast tomorrow's notional volume, nor vice versa. The correlation is contemporaneous rather than temporally predictive.
Notable Patterns, Clusters, and Outliers Several features stand out in the data. The bulk of observations cluster in the lower-left region — VIX values roughly between 11 and 20 paired with notional volumes in the 12–20 billion range — reflecting the relatively calm market conditions that dominated much of early-to-mid 2015. However, a distinct upper-right cluster emerges at higher VIX readings (roughly 25–40), corresponding to notably elevated notional volumes, consistent with the well-documented August 2015 market selloff. A handful of points appear as potential outliers: one observation near VIX ~40 with volume ~36 (likely the August 24th flash crash) and several high-volume, moderate-VIX points that deviate from the general trend. These extreme events disproportionately drive the overall correlation, raising questions about whether the relationship holds as robustly during calm periods.
Confounding Factors and Caveats Several important caveats temper interpretation. First, axes appear to be swapped in the dataset labeling — the X-axis is attributed to notional volume while the Y-axis is labeled VIX, which is counterintuitive and warrants verification before drawing conclusions. Second, end-of-year calendar effects (e.g., lower December volume due to holiday trading) and structural market events like the August 2015 volatility spike may disproportionately anchor the correlation. Third, notional volume is influenced by price levels — a rising stock market inflates notional values even at constant share volumes, creating a mechanical relationship independent of volatility. Finally, the absence of Granger causality at lag 1 does not preclude lagged effects at longer horizons; intraday dynamics also cannot be captured in daily data.
Actionable Insights and Further Investigation Practitioners should avoid using VIX as a standalone predictor of next-day notional volume given the failed Granger causality tests. Instead, this correlation is better framed as a contemporaneous risk indicator — when VIX spikes, exchanges and liquidity providers should anticipate elevated volume on that same day for capacity and risk management planning. Further investigation should include: (1) testing longer Granger causality lags (2–5 days) to detect slower transmission mechanisms; (2) segmenting the analysis by regime — calm vs. stressed markets — to test whether the correlation strengthens nonlinearly above a VIX threshold (e.g., VIX 20); (3) controlling for price-level effects by analyzing share volume rather than notional value; and (4) examining whether specific exchange venues drive the volume response differently during high-volatility episodes.
X dataset: Cboe U.S. Equities Historical Market Volume Data 2015
Y dataset: VIX Daily Index
Part of experiment: Daily - Cboe U.S. Equities Historical Market Volume Data 2015 vs VIX Daily Index