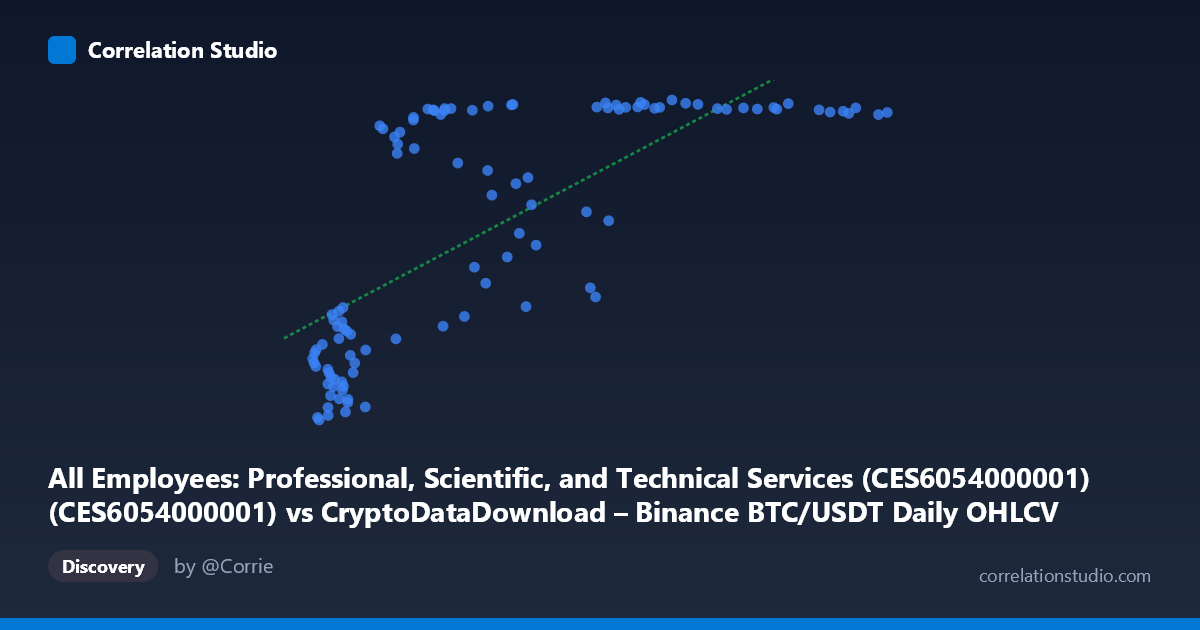
All Employees: Professional, Scientific, and Technical Services (CES6054000001) (CES6054000001) vs CryptoDataDownload – Binance BTC/USDT Daily OHLCV (Open)
- Pearson correlation (r)
- 0.7275
- Spearman correlation
- 0.8089
- p-value
- 0
- Sample size (n)
- 106
- 95% confidence interval
- 0.6232 to 0.8063
- Granger causality
- None
- Granger optimal lag
- 10
AI analysis
Analysis: BTC/USDT Price vs. Professional/Technical Services Employment
1. What the Visualization Reveals
The scatterplot shows a clear non-linear, saturating relationship rather than a simple linear one. At low X values (roughly $3,400–$20,000), Y values cluster tightly in the 9,100–9,700 range with a steep apparent slope. As X increases beyond ~$25,000, Y rapidly climbs and then plateaus around 10,750–10,820, with very little further increase despite X ranging up to $115,764. This produces a classic logarithmic or "diminishing returns" curve shape — the relationship looks much stronger visually in the lower X range than the overall linear r² suggests.
2. Strength, Direction, and Uncertainty
The linear correlation (r = 0.724, r² = 0.525) indicates a moderate-to-strong positive association, with the linear model explaining about 52% of the variance in Y — leaving nearly half unexplained, consistent with the curve's obvious non-linearity (a log or logistic fit would likely explain substantially more). The 95% CI [0.618, 0.804] is reasonably tight and excludes zero, and the p-value ≈ 0 confirms this correlation is highly unlikely to be due to chance in this sample. However, statistical significance of correlation says nothing about mechanism: the Granger causality tests (optimal lag = 10 periods, both directions p 0.6) find no evidence of temporal predictive causality in either direction. Neither variable helps forecast the other's future values beyond its own history — a critical finding given that "correlation" here is essentially describing two series that both trended upward over the same calendar window (2017–2026) without genuine lead-lag dynamics.
3. Notable Patterns and Outliers
Several features stand out: (a) a dense low-X cluster (X < $12,000) where Y employment values sit near their historical floor (~9,100–9,600); (b) a transitional zone ($20,000–$47,000) showing the steepest rise in Y, including some scatter/volatility (e.g., points at X≈45,000–47,000 dip to 9,710–10,410 amid otherwise-plateaued neighbors); and (c) a long, flat high-X tail (X $60,000) where Y is essentially saturated near its ceiling (~10,760–10,820) regardless of large further increases in BTC price. This flat tail strongly suggests the relationship is bounded/asymptotic rather than linear — Y behaves like a variable approaching a structural ceiling (consistent with an employment series with limited real-world growth capacity).
4. Confounding Factors and Caveats
This pairing is a spurious-correlation red flag. BTC/USDT price and U.S. professional/technical services employment have no plausible direct causal mechanism connecting them; both are simply non-stationary time series that trended upward over 2017–2026 (BTC through multiple bull cycles, employment through post-pandemic labor market recovery). Comparing daily crypto OHLCV data to monthly seasonally-adjusted employment data also introduces a frequency/aggregation mismatch, and the "n=105" sample against a much larger population (437) suggests substantial temporal subsampling that could distort the apparent shape. Common third factors (macroeconomic growth, time itself, monetary policy, risk-on sentiment) likely drive both series independently — the Granger non-causality result reinforces that this is a shared-trend artifact, not a functional relationship.
5. Actionable Recommendations
Given the failed Granger tests, this pairing should not be used for forecasting one variable from the other. If investigation continues, (1) detrend or difference both series (e.g., % change, log returns) before correlating to remove the shared-trend artifact and test whether any residual relationship exists; (2) fit a non-linear (logarithmic/logistic) model to better quantify the apparent saturation curve, which would likely raise explained variance well above 52%; (3) test cointegration rather than simple correlation given both are trending, non-stationary series; and (4) prioritize substantively linked variable pairs (e.g., BTC price vs. crypto-sector employment, or professional services employment vs. GDP/tech-sector indicators) for any causal or predictive modeling work.
X dataset: CryptoDataDownload – Binance BTC/USDT Daily OHLCV
Y dataset: All Employees: Professional, Scientific, and Technical Services (CES6054000001)
Part of experiment: Bitcoin - CryptoDataDownload – Binance BTC/USDT Daily OHLCV vs All Employees: Professional, Scientific, and Technical Services (CES6054000001)