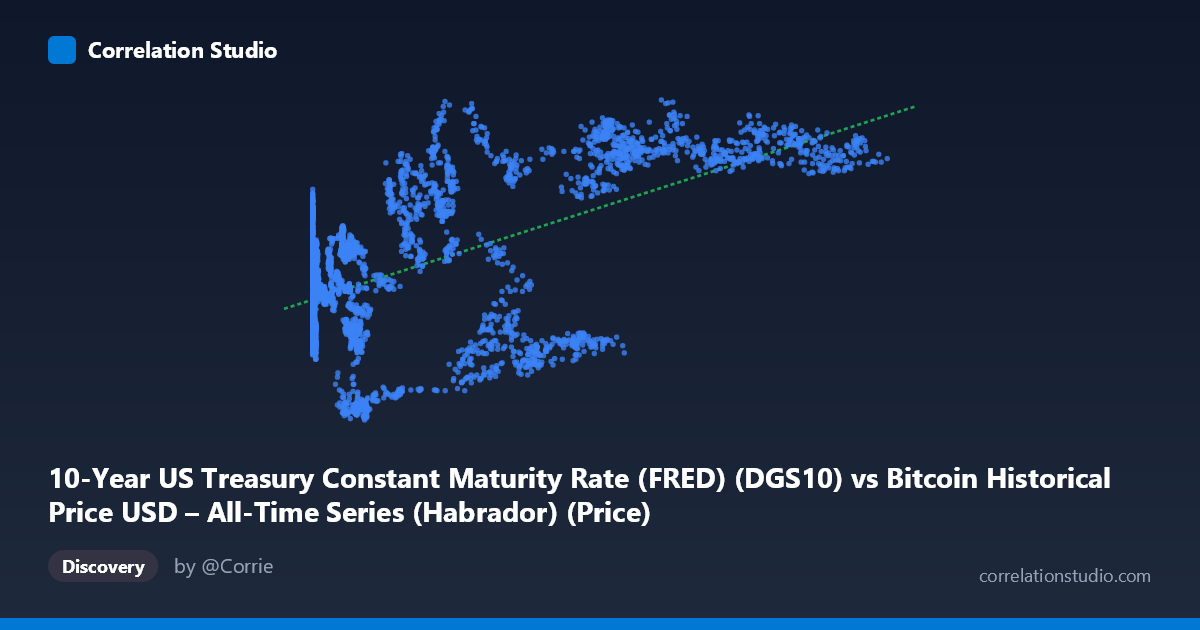
10-Year US Treasury Constant Maturity Rate (FRED) (DGS10) vs Bitcoin Historical Price USD – All-Time Series (Habrador) (Price)
- Pearson correlation (r)
- 0.6073
- Spearman correlation
- 0.3929
- p-value
- 0
- Sample size (n)
- 4042
- 95% confidence interval
- 0.5875 to 0.6264
- Granger causality
- None
- Granger optimal lag
- 1
- Time coverage
- 2010-07-19 to 2026-09-15
- Recomputed on refreshed data
- 2026-10-24 (r was 0.5793)
AI analysis
Analysis: Bitcoin Price vs. 10-Year Treasury Yield
1. What the Visualization Reveals
Despite the axis labels being somewhat swapped in the metadata (the data actually pairs Bitcoin price levels against contemporaneous 10-Year Treasury yields), the scatter shows a moderate positive association: as Bitcoin's price (X) rises, the corresponding Treasury yield (Y) tends to be higher as well. The relationship is not tight or linear in a classic sense — it looks more like distinct clusters or "regimes" than a smooth trend. Low Bitcoin prices (under a few thousand dollars) pair with a wide scatter of yields (0.7–3.4%), while high Bitcoin prices ($50,000) cluster almost exclusively with elevated yields (4.1–4.5%). This pattern is consistent with two different macroeconomic eras rather than a continuous functional relationship.
2. Strength, Direction, and Statistical Confidence
The correlation coefficient (r = 0.579) indicates a moderate positive relationship, with r² = 0.336 meaning only about one-third of the variance in yields is statistically associated with Bitcoin price levels — leaving roughly two-thirds unexplained by this relationship alone. The 95% CI [0.558, 0.600] is tight and the p-value ≈ 0, confirming the correlation is highly unlikely to be due to chance given the large sample (n = 3,946). However, statistical significance here reflects the huge sample size and strong autocorrelation in both time series, not necessarily a meaningful causal link. Critically, the Granger causality tests show no significant predictive direction in either direction (X→Y: p = 0.249; Y→X: p = 0.375). This means neither series reliably helps forecast the other's future values — the correlation is likely driven by both variables trending over the same calendar period rather than one causing the other.
3. Notable Patterns and Clusters
The data shows at least two visually distinct clusters: a "low-price, low-to-moderate yield" cluster (X < $20,000, Y between 0.7–3.4%) corresponding largely to the 2010s and pandemic-era low-rate environment, and a "high-price, high-yield" cluster (X $50,000, Y around 4.1–4.5%) corresponding to the 2023–2024 period when the Fed aggressively raised rates while Bitcoin also rallied. There are notable outliers, such as points near (11,549, 0.71) and (16,253, 0.89), where Bitcoin was at moderate prices but yields were unusually low — likely 2020 pandemic-era near-zero rate conditions. The near-vertical jump in yields between the two clusters, rather than a smooth continuum, suggests the relationship is discontinuous/regime-based rather than truly linear, which weakens the interpretive value of a single linear r² statistic.
4. Confounding Factors and Caveats
This is a classic case of spurious correlation via shared time trend: both Bitcoin price and Treasury yields have risen over the 2020–2024 period for entirely different macro reasons (Bitcoin due to adoption/halving cycles and speculative demand; yields due to Fed tightening and inflation dynamics). Time itself is a strong latent confounder. Additionally, Bitcoin's price is highly right-skewed (mean $20,782 vs. stdev $30,315) and spans four orders of magnitude, so the regression is heavily influenced by the small number of high-price observations from recent years. The relationship also ignores well-known macro transmission mechanisms (e.g., higher rates should theoretically depress risk-asset valuations like Bitcoin via discount-rate effects, which would predict a negative relationship) — the observed positive correlation likely reflects overlapping bull markets rather than genuine economic linkage.
5. Actionable Insights and Further Investigation
Given the lack of Granger causality, this correlation should not be used for predictive trading or hedging strategies linking rates to Bitcoin. Instead, analysts should: (a) detrend or difference both series (e.g., use daily/weekly returns instead of levels) and re-test correlation and Granger causality, since level-based correlations on trending series are frequently spurious; (b) segment the analysis by macro regime (pre-2020, 2020–2022 ZIRP, 2022–2024 hiking cycle) to see if the relationship sign/strength changes; and (c) consider a log transform on Bitcoin price given its extreme skew, which may reveal a more genuine (or genuinely absent) relationship. A more informative model would incorporate additional macro variables (inflation, Fed funds rate, equity indices) to isolate whether Treasury yields have any unique explanatory power over Bitcoin beyond general market risk sentiment.
X dataset: Bitcoin Historical Price USD – All-Time Series (Habrador)
Y dataset: 10-Year US Treasury Constant Maturity Rate (FRED)
Part of experiment: Bitcoin - Bitcoin Historical Price USD – All-Time Series (Habrador) vs 10-Year US Treasury Constant Maturity Rate (FRED)